. 2023 Mar 1;19(3):e1010656.
doi: 10.1371/journal.pgen.1010656. eCollection 2023 Mar.

The RNA binding protein DND1 is elevated in a subpopulation of pro-spermatogonia and targets chromatin modifiers and translational machinery during late gestation

Affiliations

The RNA binding protein DND1 is elevated in a subpopulation of pro-spermatogonia and targets chromatin modifiers and translational machinery during late gestation

Victor A Ruthig et al. PLoS Genet. .

Abstract

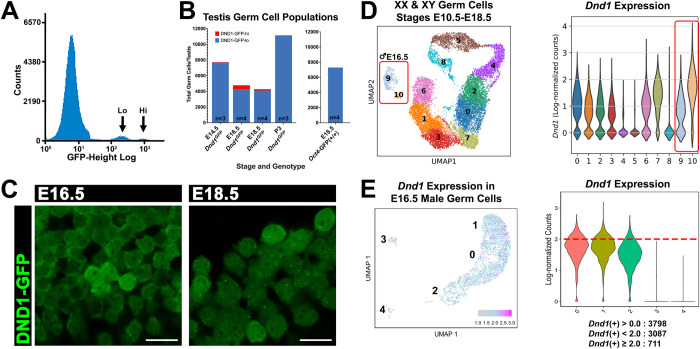
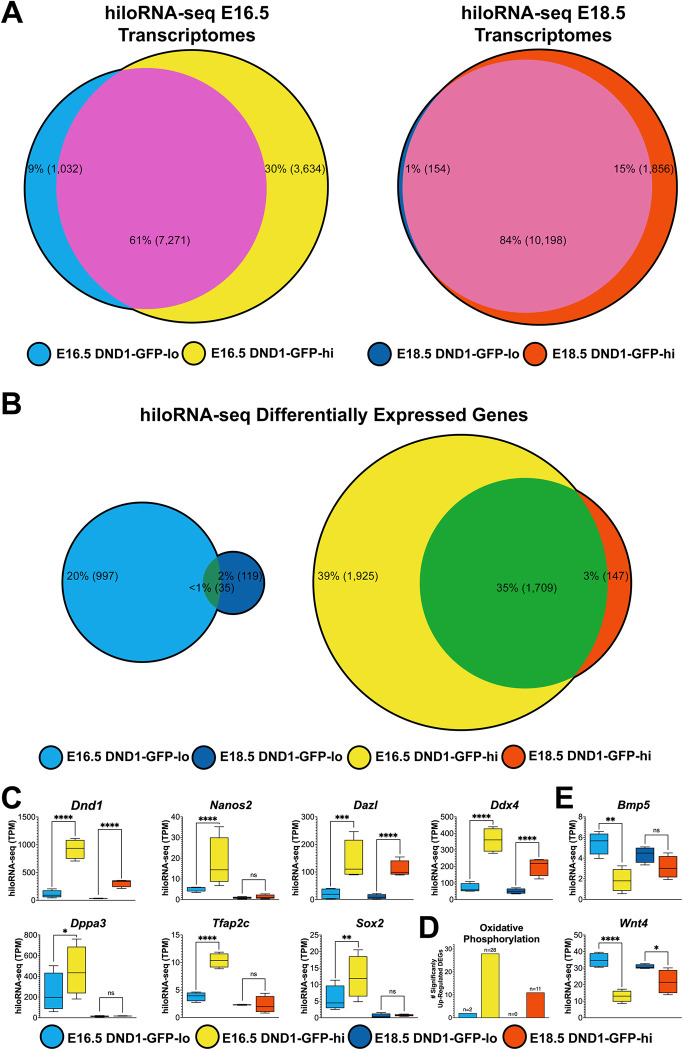
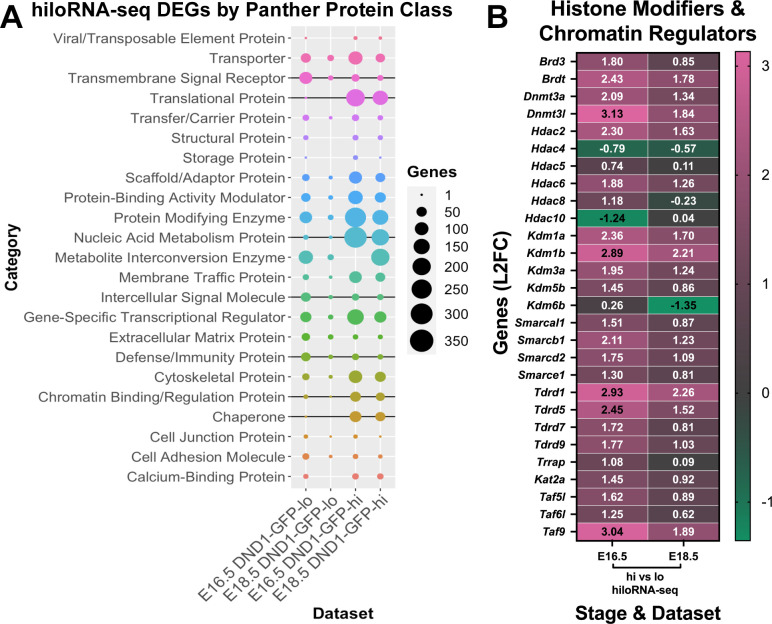
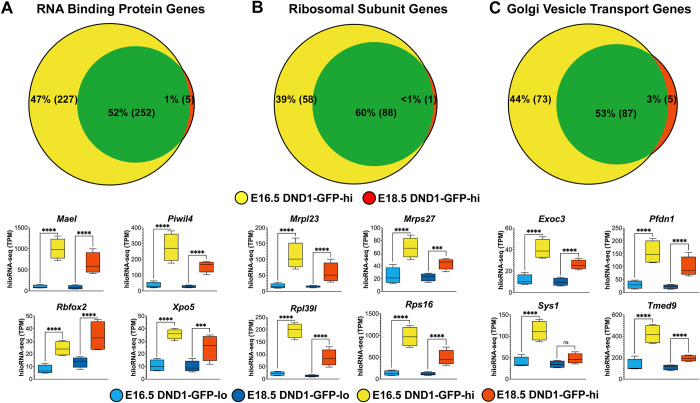
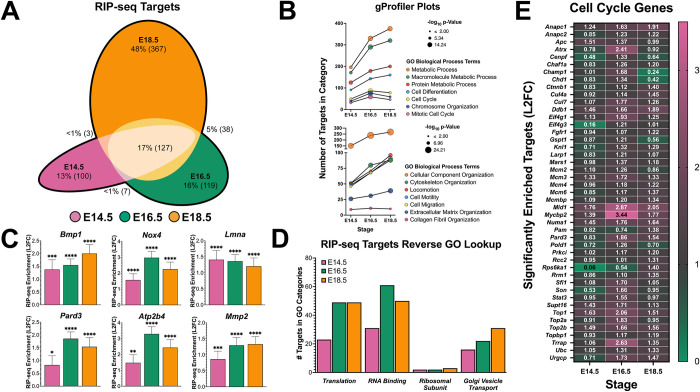
DND1 is essential to maintain germ cell identity. Loss of Dnd1 function results in germ cell differentiation to teratomas in some inbred strains of mice or to somatic fates in zebrafish. Using our knock-in mouse line in which a functional fusion protein between DND1 and GFP is expressed from the endogenous locus (Dnd1GFP), we distinguished two male germ cell (MGC) populations during late gestation cell cycle arrest (G0), consistent with recent reports of heterogeneity among MGCs. Most MGCs express lower levels of DND1-GFP (DND1-GFP-lo), but some MGCs express elevated levels of DND1-GFP (DND1-GFP-hi). A RNA-seq time course confirmed high Dnd1 transcript levels in DND1-GFP-hi cells along with 5-10-fold higher levels for multiple epigenetic regulators. Using antibodies against DND1-GFP for RNA immunoprecipitation (RIP)-sequencing, we identified multiple epigenetic and translational regulators that are binding targets of DND1 during G0 including DNA methyltransferases (Dnmts), histone deacetylases (Hdacs), Tudor domain proteins (Tdrds), actin dependent regulators (Smarcs), and a group of ribosomal and Golgi proteins. These data suggest that in DND1-GFP-hi cells, DND1 hosts coordinating mRNA regulons that consist of functionally related and localized groups of epigenetic enzymes and translational components.


Conflict of interest statement

The authors have no competing interests to disclose.

Figures

Fig 1
Fig 1. Fetal male germ cells express low or high levels of DND1-GFP and Dnd1.
A: FACS histogram showing one DND1-GFP-negative, and two DND1-GFP-positive populations, representing DND1-GFP-lo and DND1-GFP-hi cells at E18.5. B: FACS quantification for the number of DND1-GFP-lo and DND1-GFP-hi germ cells from E14.5, E16.5, E18.5, P3 DND1-GFP testes (n = 3,4,4,3 respectively). FACS analysis of germ cells from E18.5 Oct4-GFP testes (n = 4) did not show GFP low and high subpopulations. C: Whole mount confocal imaging of unstained freshly dissected E16.5 and E18.5 DND1-GFP testes showing heterogenous endogenous DND1-GFP fluorescence. Scale bar = 20 μm. D: scRNA-seq UMAP for XX and XY germ cell populations from E9.0-E16.5 [32] and violin plot showing DND1 expression levels in clusters 0–10. Red box surrounds E16.5 male germ cell populations represented by clusters 9 and 10. Corresponding violin plots show that clusters 9 and 10 contain cells expressing low and high levels of Dnd1 respectively. E: re-analysis of E16.5 male germ cell scRNA-seq from [31]. UMAP colored to show low to high levels of Dnd1 expression (grey to blue to pink). Violin plot showing levels of Dnd1 expression in clusters 0, 1, 2, 3, and 4, with a level of 2.0 denoted by red broken line. Quantification of total number of Dnd1-expressing cells with expression ≥2.0 = 711 (of 3798 total DND1+ cells).
Fig 2
Fig 2. Although the germ cell transcriptome is mostly shared between DND1-GFP-lo and DND1-GFP-hi cells at E16.5 and E18.5, the subset of significant differentially expressed genes indicate functional differences between DND1-GFP-lo and DND1-GFP-hi cells.
A: Global shared (pink) versus DND1-GFP-lo (blue) or DND1-GFP-hi (yellow; red) specific expression at E16.5 and E18.5 from hiloRNA-seq analysis. B: Euler plots of E16.5 DND1-GFP-lo (blue), E16.5 DND1-GFP-hi (yellow), E18.5 DND1-GFP-lo (dark blue), E18.5 DND1-GFP-hi (red) show global shared and significant differentially expressed genes. C: Expression of Dnd1 declined between E16.5 and E18.5 but was consistently higher in Dnd1-GFP-hi cells. Other markers associated with the germline stem cell population behaved in a similar manner. D: Transcripts of genes associated with the oxidative phosphorylation pathway were elevated in DND1-GFP-hi cells. E: Examples of intercellular signaling genes that were expressed higher in Dnd1-GFP-lo cells. hiloRNA-seq expression P-value (DESeq2) between DND1-GFP-lo and DND1-GFP-hi cells at E16.5 and E18.5: not significant (ns), <0.05 (*), <0.01 (**), <0.001 (***), <0.0001 (****).
Fig 3
Fig 3. DND1-GFP-lo cells express more phosphatidylserine on their outer membrane, as seen through Annexin V fluorescence.
A: Representative profiles of Annexin V fluorescence in E16.5 DND1-GFP-hi (yellow) and E16.5 DND1-GFP-lo (sky blue) populations. B: Geometric mean of Annexin V fluorescence in DND1-GFP-lo and DND1-GFP-hi cells. C: Representative fluorescence profile of DND1-GFP and Annexin V. Q1 (quadrant 1) = DND1-GFP-lo cells + Annexin V-positive. Q2 = DND1-GFP-hi cells + Annexin V-positive. Q3 = DND1-GFP-hi cells + Annexin V-negative. Q4 = DND1-GFP-lo cells + Annexin V-negative. D: Percent of DND1-GFP-lo cells and DND1-GFP-hi cells that are Annexin V-positive. E: Percent of total Annexin V-positive and negative cells that are DND1-GFP-lo cells. A-E: Technical replicates = 4, biological replicates > 2 fetal testes. P value: ****<0.0001, *** = 0.0008, ** = 0.0014.
Fig 4
Fig 4. Expression of some protein class categories are significantly different in DND1-GFP-hi vs DND1-GFP-lo cells and consistent between E16.5 and E18.5.
A: PANTHER analysis of significant differentially expressed genes in E16.5 and E18.5 DND1-GFP-lo cells, and E16.5 and E18.5 DND1-GFP-hi cells. Results displayed as protein class categories by dataset and graphed with the number of genes in each category corresponding to the size of the circle. Protein classes distinguishing DND1-GFP-lo cells at both stages include “Defense and Immunity”, “Transmembrane Signal Receptor” and “Intercellular Signal Molecule” (noted with black vertical line). Protein classes distinguishing DND1-GFP-hi cells at both stages include “Chaperone”, “Chromatin Binding/Regulation”, “Nucleic Acid Metabolism”, and “Translational” (noted with black vertical line). B: Heat map of chromatin / epigenetic regulators showing: L2FC in DND1-GFP-hi vs DND1-GFP-lo cells from hiloRNA-seq (E16.5, E18.5).
Fig 5
Fig 5. In DND1-GFP-hi cells, most transcripts for proteins involved in RNA binding, ribosomal subunits, and Golgi vesicle transport are either shared between E16.5 and E18.5, or unique to E16.5.
Venn diagrams showing temporal distribution (E16.5 (yellow), E18.5 (red)) of genes in three GO biological processes significantly over-represented in DND1-GFP-hi cells compared to DND1-GFP-lo cells: (A) RNA binding protein genes, (B) ribosomal subunit genes, and (C) Golgi vesicle transport genes. Box-and-whisker plots show expression for example genes in each category. hiloRNA-seq expression P-value (DESeq2) between DND1-GFP-lo and DND1-GFP-hi cells at E16.5 and E18.5: not significant (ns), <0.05 (*), <0.01 (**), <0.001 (***), <0.0001 (****).
Fig 6
Fig 6. RIP-seq reveals conservation of many DND1 targets at all 3 stages.
A: Euler plot of temporal distribution (E14.5 (pink), E16.5 (green), E18. (orange)) of significantly enriched transcript targets of DND1. B: Bubble plot from g:Profiler analysis of significantly enriched transcript targets of DND1 showing change in number of targets (Y-axis) for prominent GO biological processes related to cell cycle and metabolism (upper), and cell movement and ECM-cytoskeleton organization (lower) the -log10 P-value of each GO biological process is denoted by bubble size with developmental stages progressing along the X-axis. C: Bar graphs showing target enrichment as a function of L2FC at E14.5, E16.5, E18.5. RIP-seq enrichment P-value (DESeq2): not significant (ns), <0.05 (*), <0.01 (**), <0.001 (***), <0.0001 (****). D: number of significantly enriched transcript targets at E14.5, E16.5, E18.5 for GO biological processes identified in hiloRNA-seq analysis (Fig 4A): translation, RNA binding, ribosomal subunit, Golgi vesicle transport. E: Heatmap of significantly enriched transcript targets at E14.5, E16.5, E18.5 for the GO biological process cell cycle.

Similar articles

References

    1. Suzuki A, Niimi Y, Shinmyozu K, Zhou Z, Kiso M, Saga Y. Dead end1 is an essential partner of NANOS2 for selective binding of target RNAs in male germ cell development. EMBO Rep. 2016;17(1):37–46. doi: 10.15252/embr.201540828 - DOI - PMC - PubMed
    1. Yamaji M, Jishage M, Meyer C, Suryawanshi H, Der E, Yamaji M, et al.. DND1 maintains germline stem cells via recruitment of the CCR4-NOT complex to target mRNAs. Nature. 2017;543(7646):568–72. doi: 10.1038/nature21690 - DOI - PMC - PubMed
    1. Cook MS, Coveney D, Batchvarov I, Nadeau JH, Capel B. BAX-mediated cell death affects early germ cell loss and incidence of testicular teratomas in Dnd1(Ter/Ter) mice. Developmental biology. 2009;328(2):377–83. doi: 10.1016/j.ydbio.2009.01.041 - DOI - PMC - PubMed
    1. Sakurai T, Iguchi T, Moriwaki K, Noguchi M. The ter mutation first causes primordial germ cell deficiency in ter/ter mouse embryos at 8 days of gestation. Development, Growth & Differentiation. 1995;37(3):293–302. - PubMed
    1. Cook MS, Munger SC, Nadeau JH, Capel B. Regulation of male germ cell cycle arrest and differentiation by DND1 is modulated by genetic background. Development. 2011;138(1):23–32. doi: 10.1242/dev.057000 - DOI - PMC - PubMed

Publication types