. 2023 May 1;34(5):ar35.
doi: 10.1091/mbc.E22-05-0191. Epub 2023 Mar 1.

Mechanosensitive mTORC2 independently coordinates leading and trailing edge polarity programs during neutrophil migration

Affiliations

Mechanosensitive mTORC2 independently coordinates leading and trailing edge polarity programs during neutrophil migration

Suvrajit Saha et al. Mol Biol Cell. .

Abstract

By acting both upstream of and downstream from biochemical organizers of the cytoskeleton, physical forces function as central integrators of cell shape and movement. Here we use a combination of genetic, pharmacological, and optogenetic perturbations to probe the role of the conserved mechanosensitive mTOR complex 2 (mTORC2) programs in neutrophil polarity and motility. We find that the tension-based inhibition of leading-edge signals (Rac, F-actin) that underlies protrusion competition is gated by the kinase-independent role of the complex, whereas the regulation of RhoA and myosin II-based contractility at the trailing edge depend on mTORC2 kinase activity. mTORC2 is essential for spatial and temporal coordination of the front and back polarity programs for persistent migration under confinement. This mechanosensory pathway integrates multiple upstream signals, and we find that membrane stretch synergizes with biochemical co-input phosphatidylinositol (3,4,5)-trisphosphate to robustly amplify mTORC2 activation. Our results suggest that different signaling arms of mTORC2 regulate spatially and molecularly divergent cytoskeletal programs for efficient coordination of neutrophil shape and movement.


Figures
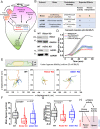
FIGURE 1:
FIGURE 1:
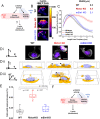
Rictor/mTORC2 is a regulator of neutrophil motility. (A) mTORC2 connects membrane stretch to regulation of front (magenta) and back (green) polarity programs, but how mTORC2 is activated (purely mechanical or requires biochemical co-inputs) and what aspect of mTORC2 activation (kinase-dependent vs. independent roles) regulates these polarity signals is not understood. (B) To dissect the roles of kinase-dependent and kinase-independent roles of mTORC2, we generated individual CRISPR-Cas9 knockout lines of key components of the complex: Rictor (which scaffolds and aids structural integrity of the complex) or mSin1 (which primarily aids kinase activity). Additionally, we use mTOR kinase inhibitors (here KU-0063794; KU) to phenocopy mSin1 KO defects. (C) Representative immunoblots of wild-type (WT) HL-60 cells and gene-edited Rictor KO (top) and mSin1 KO (bottom) clonal HL-60 line to validate the loss of Rictor or mSin1 protein expression. GAPDH was used as a loading control. (D) Perturbation of mTORC2 activities in Rictor KO (n = 3; red), mSin1 KO (n = 3; blue), and via mTOR kinase inhibitor (KU; n = 3; green) all led to defective transwell migration toward chemoattractant 20 nM fMLP in comparison to WT cells (n = 6; black). Mean ± SEM is plotted; n indicates independent replicates. (E) Schematic shows neutrophil-like dHL60 cell moving under an agarose (2%) overlay with uniform chemoattractant (25 nM fMLP). Randomly chosen representative tracks (15 each) of wild-type (WT), Rictor KO, or mSin1 KO cells over a 12-min observation window; axes show x-y displacement in micrometers. Rictor KO cells migrate poorly and have markedly shorter displacements. (F, G) Box plots (with kernel smooth distribution curve) show mean speed (F) and persistence (G; ratio of displacement/distance) of individual tracks. Both Rictor KO and mSin1 KO cells show a significant reduction (p < 0.01; one-way ANOVA with Tukey-means comparison) in migration speed compared with WT. However, only Rictor KO show a significant decrease in the persistence (p < 0.01; one-way ANOVA with Tukey-means comparison). n = 294 (WT), 138 (RictorKO), and 165 (mSin1 KO) tracks from individual cells pooled across three independent experiments. For box plots, median is indicated by the line, interquartile range (IQR) sets the box width, and error bars indicate 10th–90th percentile. (H) Schematic highlights the phenotypes observed for mSin1 KO and Rictor KO cells. Kinase-dependent roles of mTORC2 appear to regulate speed whereas kinase-independent roles regulate both persistence and speed.
FIGURE 2:
FIGURE 2:
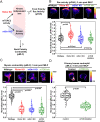
Kinase-independent arm of Rictor/mTORC2 restricts the zone of F-actin assembly to the front of the cells. (A) Schematic shows how we are probing the kinase-dependent vs. independent roles of mTORC2 in regulating F-actin levels and spatial organization. (B) Maximum intensity projections of Alexa647-phalloidin stained F-actin obtained from confocal z-stacks (10 μm in z-depth) for WT, Rictor KO, or mSin1 KO dHL60 cells, 5 min after stimulation with 25 nM fMLP. Fire-LUT shows the intensity scaling; scale bar 10 μm. (C) F-actin intensity (normalized to individual peak) line scans (mean ± SEM) obtained (dashed lines on B) from WT (n = 35), Rictor KO (n = 48), or mSin1 KO (n = 26) dHL60 cells pooled from two independent experiments. Rictor KO (red) has a wider lateral zone of leading-edge F-actin in comparison to WT (black) and mSin1 KO (blue); quantified by bi-Gaussian fitting of the intensity profile. (D) Representa­tive WT, Rictor KO, and mSin1 KO dHL60 cells shown as either maximum intensity projection (D i; xy plane; scale bar 10 μm); or a ChimeraX 3D reconstruction in yz plane (D ii) and a tilted xz plane (D iii) to highlight the axial features of F-actin (gold) distribution and nucleus (blue) as reference. Rictor KO cell shows protrusions out of the plane of the substrate that are rarely present in either WT or mSin1 KO cells. (E) Box plots quantify fraction of cells with axial protrusions obtained from ChimeraX 3D-reconstruction views of each cell type (∼10 fields; at least 100 cells analyzed for each condition) across two independent experiments. RictorKO cells have significantly (p < 0.01; one-way ANOVA with Tukey’s mean comparison test) higher fraction of cells with axial protrusions. For box plots, median is indicated by the line, interqurtile range sets the box width, and error bars indicate 10th–90th percentile. (F) Defects observed in F-actin distribution for only RictorKO dHL60 cells but not mSin1 KO cells suggests a kinase-independent arm of Rictor/mTORC2 is required for negative feedback on F-actin assembly, distribution, and organization.
FIGURE 3:
FIGURE 3:
Kinase-independent arm of Rictor/mTORC2 inhibits Rac activity while its kinase role stimulates myosin contractility. (A) Schematic shows how we probe the kinase-dependent vs. independent roles of mTORC2 in regulating front (Rac activity) and back (myosin contractility) polarity programs. (B) Phospho-PAK (pPAK) immunostaining (labeled with Alexa 488 secondary antibody) of WT, Rictor KO, mSin1 KO, and WT cells treated with mTOR Inhibitor (10 μM KU) adhered to fibronectin-coated glass; 3 min after stimulation with 25 nM fMLP. Box plots show the quantification of total pPAK intensity levels normalized to WT population from confocal z-stacks as shown above (40–50 fields and at least 300 cells for each condition) pooled from four independent experiments. Only Rictor KO cells exhibit significantly elevated pPAK levels compared with WT cells (p < 0.05; one-way ANOVA with Tukey’s mean comparison test). (C) Phospho-myosin light chain (pMLC) immunostaining (labeled with Alexa 488 secondary antibody) of WT, Rictor KO, mSin1 KO, and WT cells treated with mTOR inhibitor (10 μM KU) adhered to fibronectin-coated glass; 5 min after stimulation with 25 nM fMLP. Box plots show the quantification of total pMLC intensity levels normalized to WT population from confocal z-stacks as shown above (30–50 fields and at least 300 cells across each condition) pooled from three independent experiments. Perturbation of mTORC2 kinase activity in Rictor KO, mSin1 KO, and upon mTOR inhibition led to a profound decrease in pMLC levels compared with WT cells (p < 0.001; one-way ANOVA with Tukey’s mean comparison test), suggesting that the kinase activity of Rictor/mTORC2 stimulates myosin contractility. (D) pMLC immunostaining of primary human neutrophils, either untreated (control) or mTOR inhibited (10 μM KU) adhered to fibronectin-coated glass; 5 min after stimulation with 25 nM fMLP. Box plots show profound reduction total pMLC intensity levels in mTOR inhibited cells normalized to control population (∼70 fields and at least 500 cells for both conditions; p < 0.001 by Mann-Whitney test) pooled from three independent experiments and healthy volunteers. All representative images (B–D) show maximum-intensity projections obtained from 10 μm z-depth confocal z-stacks; scale bar 10 μm. Dashed outlines indicate the cell boundary, and all conditions were equally intensity scaled as shown by associated Fire LUT. For all box plots (B–D), median is indicated by the line, interquartile range sets the box width, and error bars indicate 10th–90th percentile.
FIGURE 4:
FIGURE 4:
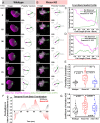
Rictor/mTORC2 is required for maintaining the spatial and temporal coordination of the front and back polarity programs. (A) Wildtype (WT) and Rictor KO (B) cells coexpressing Rac biosensor (Pak-PBD-mCherry) and RhoA biosensor (EGFP-anillin-AHPH) were plated under 2% agarose overlay and imaged every 3 s using a confocal spinning-disk microscope. Montage of images acquired over 90 s show the distribution of front (active Rac; magenta) and back (active RhoA; green) polarity signals (image, left) and the corresponding front (magenta arrow) and back (green arrow) polarity vectors. The cell centroid for each frame is indicated by the open circle and its displacement from the grid indicates overall cell movement; scale bar 10 μm. (C, D) Anti-correlation between the intensity profile of polarity signals across the front-back axis provides a measure of spatial segregation of the front-back signals. Representative intensity profiles of Rac and RhoA biosensors obtained from line scan (dashed line in time 0 s in A and B) of WT (C) and Rictor KO (D), with computed Pearson’s correlation coefficient for each set of intensity traces (Pearson’s correlation coefficient = −0.49 for WT; −0.22 for Rictor KO). Lower Pearson’s correlation coefficient indicates better separation between front and back signals. (E) Box plots of front-back correlation values for WT (n = 23 cells), Rictor KO cells (n = 33 cells), and mSin1 KO cells (n = 20 cells) pooled from four independent experiments. Rictor KO cells have significantly higher correlation coefficient (p < 0.01; one-way ANOVA with Tukey’s mean comparison test) compared with both WT and mSin1 KO cells suggesting impaired spatial sorting of front-back polarity programs. (F) To measure the extent of temporal coordination between polarity signals, we analyzed the fluctuations in the weighted intercentroid distance between the front and back polarity biosensor intensities (indicated by the distance between the arrowheads of polarity vector in images A and B). WT cells have polarity vectors uniformly aligned to the front-back axis and maintain a stable intercentroid distance (gray), while Rictor KO cells show stronger fluctuations in intercentroid distance (red). Representative plot of fluctuations in intercentroid distance for both cell types of WT and Rictor KO. We use coefficient of variation (CV) as a metric to quantify the magnitude of the fluctuations. (G) Box plots of distribution of CV obtained for WT (n = 19 cells), Rictor KO (n = 30 cells), and mSin1 KO cells (n = 16 cells) across four independent experiments. Rictor KO cells exhibit significantly (p < 0.01) higher fluctuations in ICD compared with both WT cells, while mSin1 KO cells also exhibit a modest yet statistically significant (p < 0.05) phenotype. All statistical comparisons were done by one-way ANOVA with Tukey’s mean comparison test. These results suggest impaired temporal coordination of front and back polarity programs in mTORC2 perturbed cells. For box plots, median is indicated by the line, interquartile range sets the box width, and error bars indicate 10th–90th percentile.
FIGURE 5:
FIGURE 5:
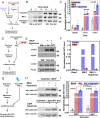
Mechanical stretch synergizes with PIP3 generation to amplify mTORC2. (A) Probing whether mTORC2 activation can be amplified by a combination of mechanical stretch (here applied by 50% hypotonic shock) and additional biochemical inputs downstream from chemoattractant fMLP stimulation. (B) To probe the logic of mTORC2 activity amplification, dHL-60 cells were subjected to either just hypotonic media (50% osmolarity reduction), stimulated with 100 nM fMLP (fMLP only), or subjected to both inputs (hypotonic + 100 nM fMLP). mTORC2 activity was assayed in basal (0 min) and different time points (1 and 3 min) using phospho-Akt S473 and pan-Akt immunoblots, and representative immunoblot panels are shown. (C) mTORC2 activity (pAkt/panAkt ratio) was quantified and normalized to 3 min fMLP condition for each experiment; plotted as mean ± SEM from three independent experiments. Hypotonic shock (gray bars) alone stimulates very low levels of mTORC2 activity (gray bar), and chemoattractant addition is needed to trigger robust activation of signaling (red bar). However, a combination of fMLP and hypotonic shock (blue bar) significantly amplifies the signaling output of mTORC2 (p < 0.05, unpaired t test). Each bar represents mean ± SEM from three independent experiments. (D) Probing the necessity of chemoattractant-driven PIP3 generation (using PI3Kγ inhibitor PIK-90) for synergistic amplification of mTORC2 activity upon hypotonic shock. (E) Representative immunoblots of pAktS473 and pan-Akt to measure mTORC2 activation. Control (top) or PIK-90 (1 μM; bottom) treated dHL60 cells were assayed for mTORC2 activity in the absence (basal activity; −/− condition; left lane) or in the presence of fMLP alone (+/−; middle lane) or a combination of fMLP and hypotonic shock (+/+; right lane). In the presence of PIK-90, mTORC2 activity is severely attenuated (with background levels of pAkt S473 detected). (F) mTORC2 activity (pAkt/panAkt) was quantified across the three conditions and normalized to control (fMLP alone) for each experiment; plotted as mean ± SEM from three independent experiments. The profound reduction of mTORC2 signaling output upon inhibition of PI3K activity suggests PIP3 is a necessary co-input for activation (fMLP) and amplification of mTORC2 activity upon stretching (fMLP + hypotonic). (G) Testing whether PIP3 (via optogenetic activation) is sufficient to activate mTORC2 and can collaborate with mechanical stretch to amplify mTORC2 activation. (H) Representative immunoblots of pAktS473 and pan-Akt of dHL60 cells activated either with chemoattractant (20 nM fMLP for 3 min; top panel) or using light at 475 nm (∼1 mW power for 3 min) to activate Opto-PI3K (bottom panel). For both inputs, pAkt/pan-Akt was assayed for basal (left lane; −/−), just stimulus (middle lane; +/−), or when paired with hypotonic media (right lane; +/+). (I) mTORC2 activity (assayed by pAkt/AKT ratio) quantified across the three different conditions (H) for both activator (fMLP or light) and normalized using the activator-only condition (just fMLP or light) for each experiment; plotted as mean ± SEM from three independent experiments. mTORC2 signaling activity is significantly boosted upon hypotonic shock (p < 0.01 for fMLP; p < 0.05 for Light; both by unpaired t test) with similar extent of amplification observed when either fMLP or Opto-PI3K was used as activator (p = 0.85; ns; unpaired t test). This indicates PIP3 generation is sufficient to synergize with mechanical stretch to amplify mTORC2 activity.
FIGURE 6:
FIGURE 6:
Working model for the molecular logic of mTORC2-based regulation of front and back cytoskeletal programs. (A) Membrane stretches and biochemical signals from PIP3 synergize to activate mTORC2 signaling programs and drive robust amplification of its kinase activity output. Noncatalytic kinase-independent roles of Rictor/mTORC2 (black dashed arrow) allow stretch-dependent inhibition of front polarity signals (Rac) and restrict F-actin protrusion to the leading edge. The kinase roles of mTORC2 are necessary to stimulate myosin contractility (pMLC) at the back. While the spatial logic and molecular details of this circuit remains poorly understood, our results suggest this bifurcation of the downstream mTORC2 activities enables independent regulation of the spatially polarized front (magenta) and back (green) programs. (B) The regulatory circuit for mTORC2-based front-back coordination (A) is essential for persistent movement in confined environments where cells experience mechanical stretch (like under agarose). In the absence of mTORC2 activities (as in Rictor KO), cells exhibit elevated Rac activity (Stronger Front) and lowered contractility (Weaker Back); consequently, front-back coordination is lost resulting in impaired speed and persistence of motility in confined environment.

Similar articles

Cited by

References

    1. Agarwal NK, Chen C-H, Cho H, Boulbès DR, Spooner E, Sarbassov DD (2013). Rictor regulates cell migration by suppressing RhoGDI2. Oncogene 32, 2521–2526. - PMC - PubMed
    1. Artemenko Y, Axiotakis L, Borleis J, Iglesias PA, Devreotes PN (2016). Chemical and mechanical stimuli act on common signal transduction and cytoskeletal networks. Proc Natl Acad Sci USA 113, E7500–E7509. - PMC - PubMed
    1. Bell GRR, Natwick DE, Collins SR (2018). Parallel High-Resolution Imaging of Leukocyte Chemotaxis Under Agarose with Rho-Family GTPase Biosensors. New York, NY: Humana Press, 71–85. - PubMed
    1. Berchtold D, Piccolis M, Chiaruttini N, Riezman I, Riezman H, Roux A, Walther TC, Loewith R (2012). Plasma membrane stress induces relocalization of Slm proteins and activation of TORC2 to promote sphingolipid synthesis. Nat Cell Biol 14, 542–547. - PubMed
    1. Bercury KK, Dai JX, Sachs HH, Ahrendsen JT, Wood TL, Macklin WB (2014). Conditional ablation of raptor or rictor has differential impact on oligodendrocyte differentiation and CNS myelination. J Neurosci 34, 4466–4480. - PMC - PubMed

Publication types

MeSH terms

Substances