. 2023 Mar;55(3):541-554.
doi: 10.1038/s12276-023-00951-z. Epub 2023 Mar 1.

Senescent cancer cell-derived nanovesicle as a personalized therapeutic cancer vaccine

Affiliations

Senescent cancer cell-derived nanovesicle as a personalized therapeutic cancer vaccine

Jihye Hong et al. Exp Mol Med. 2023 Mar.

Abstract

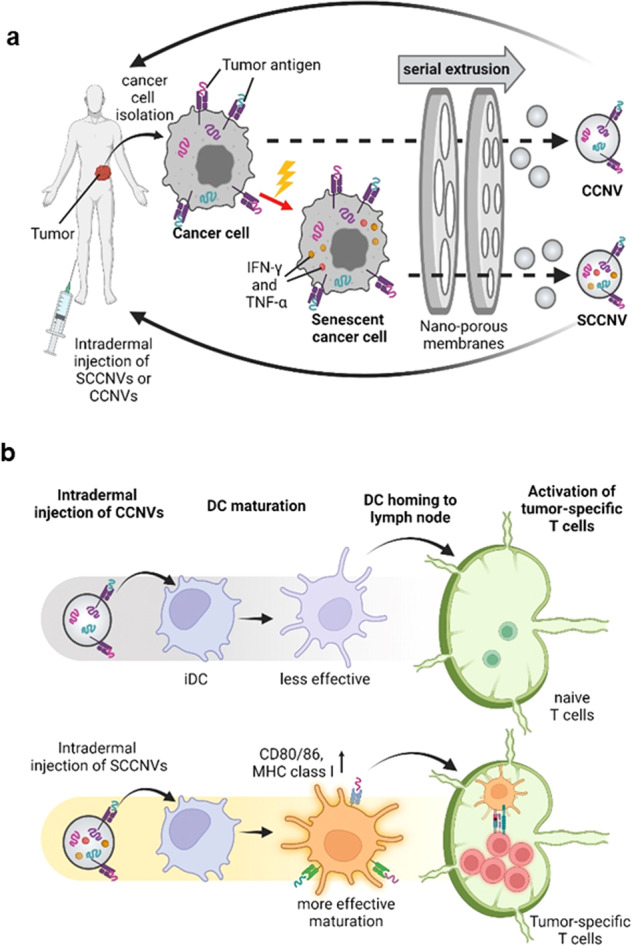
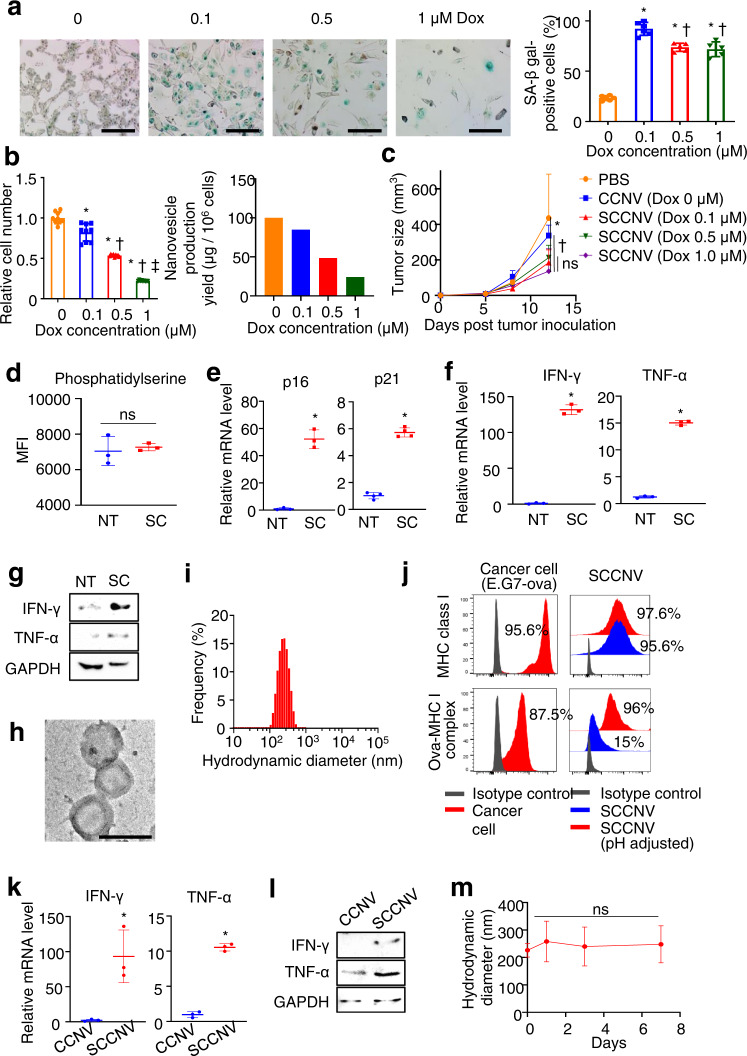
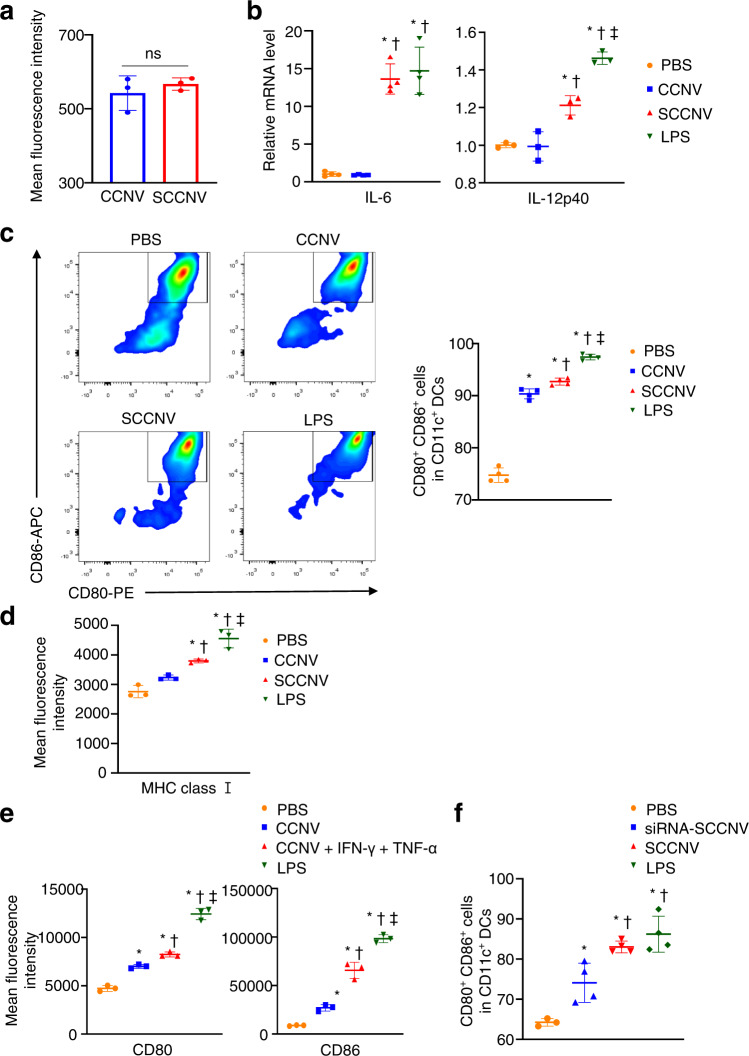
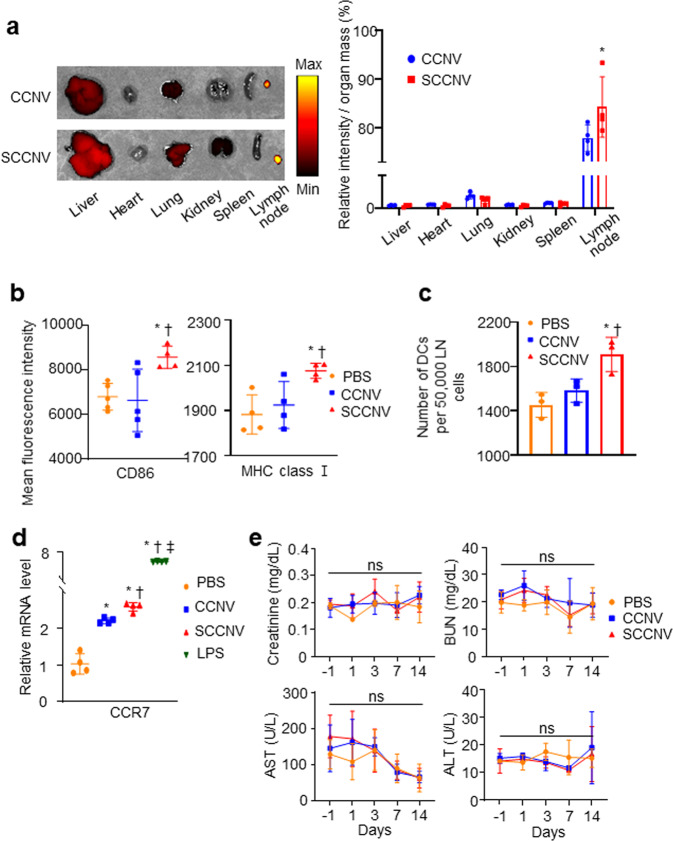
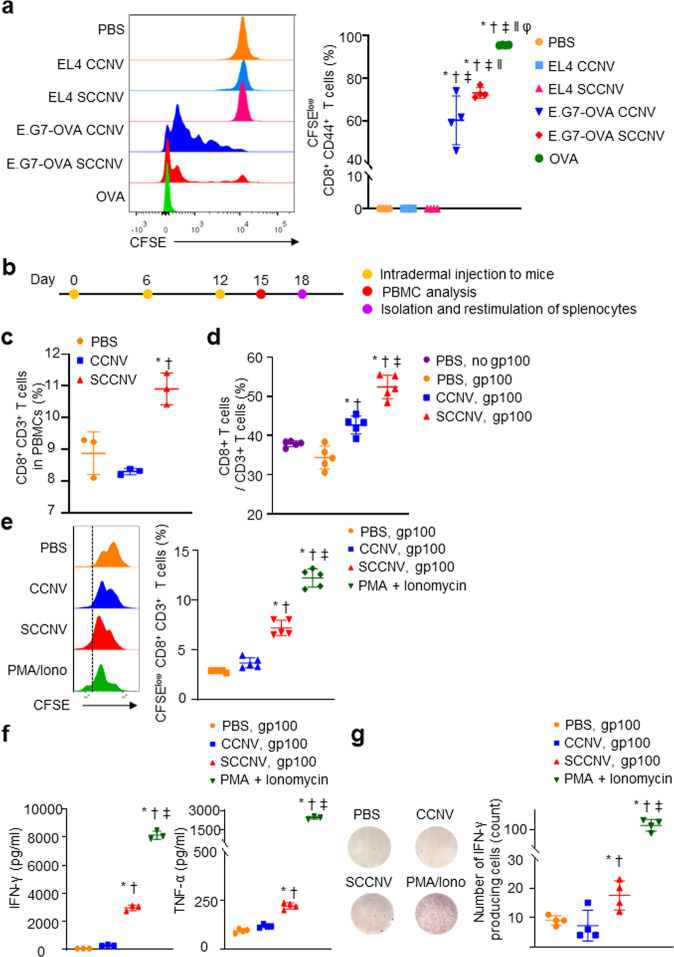
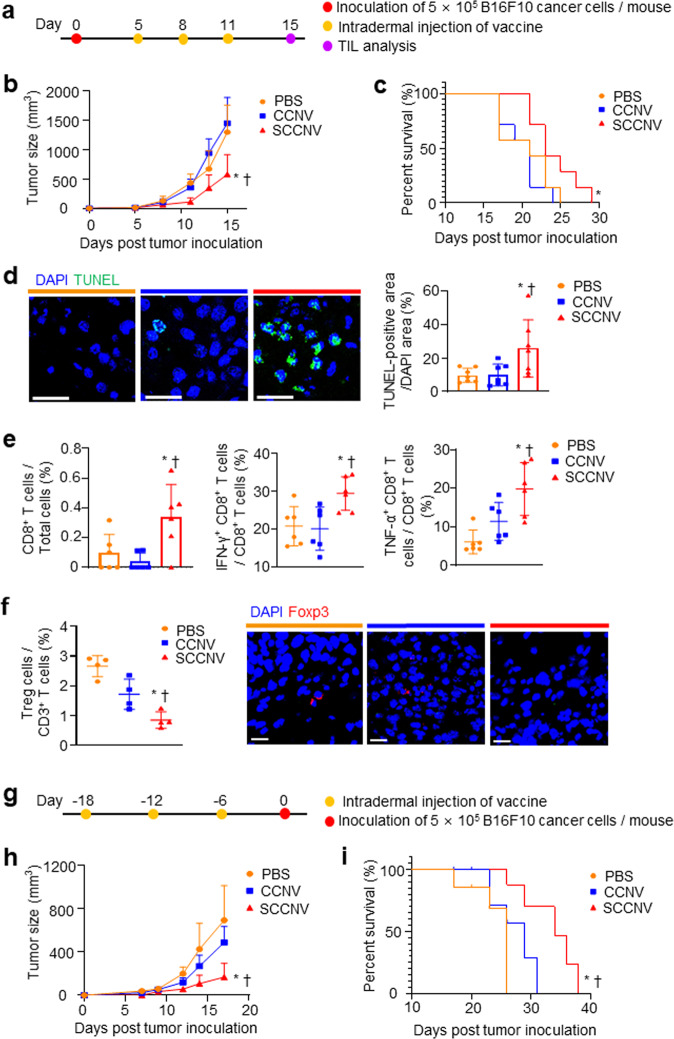
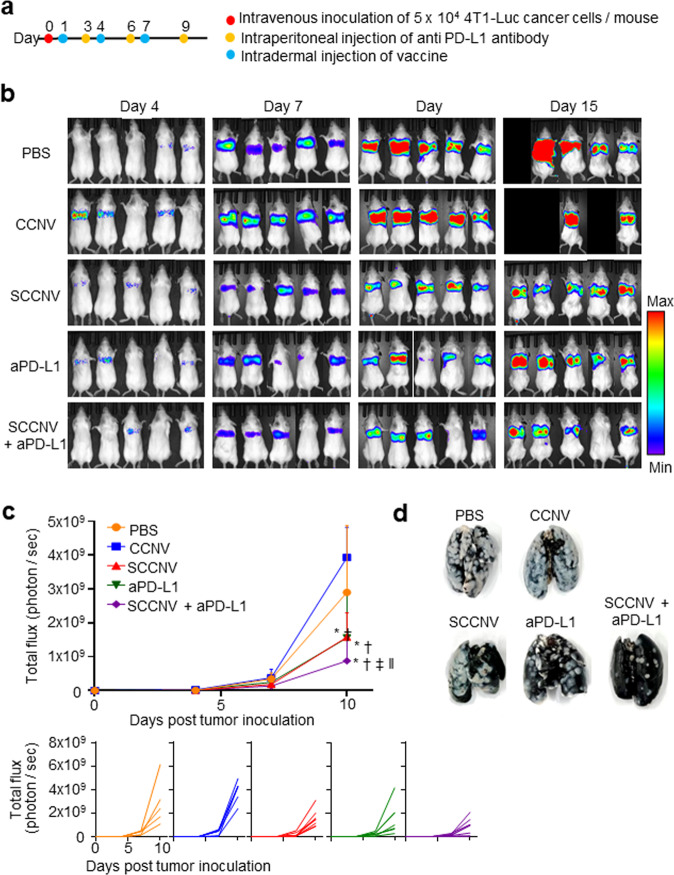
The development of therapeutic cancer vaccines (TCVs) that provide clinical benefits is challenging mainly due to difficulties in identifying immunogenic tumor antigens and effectively inducing antitumor immunity. Furthermore, there is an urgent need for personalized TCVs because only a limited number of tumor antigens are shared among cancer patients. Several autologous nanovaccines that do not require the identification of immunogenic tumor antigens have been proposed as personalized TCVs. However, these nanovaccines generally require exogenous adjuvants (e.g., Toll-like receptor agonists) to improve vaccine immunogenicity, which raises safety concerns. Here, we present senescent cancer cell-derived nanovesicle (SCCNV) as a personalized TCV that provides patient-specific tumor antigens and improved vaccine immunogenicity without the use of exogenous adjuvants. SCCNVs are prepared by inducing senescence in cancer cells ex vivo and subsequently extruding the senescent cancer cells through nanoporous membranes. In the clinical setting, SCCNVs can be prepared from autologous cancer cells from the blood of liquid tumor patients or from tumors surgically removed from solid cancer patients. SCCNVs also contain interferon-γ and tumor necrosis factor-α, which are expressed during senescence. These endogenous cytokines act as adjuvants and enhance vaccine immunogenicity, avoiding the need for exogenous adjuvants. Intradermally injected SCCNVs effectively activate dendritic cells and tumor-specific T cells and inhibit primary and metastatic tumor growth and tumor recurrence. SCCNV therapy showed an efficacy similar to that of immune checkpoint blockade (ICB) therapy and synergized with ICB. SCCNVs, which can be prepared using a simple and facile procedure, show potential as personalized TCVs.


Conflict of interest statement

The authors declare no competing interests.

Figures

Fig. 1
Fig. 1. Experimental scheme of SCCNVs.
Illustration of (a) SCCNV preparation and personalized cancer vaccination and (b) the proposed mode of action of the vaccines. SCCNV senescent cancer cell-derived nanovesicle, CCNV cancer cell-derived nanovesicle, iDC immature dendritic cell, mDC mature dendritic cell.
Fig. 2
Fig. 2. Characterization of SCCNVs.
a SA β-gal staining (green) of B16F10 cancer cells following senescence induction by treatment with various concentrations of doxorubicin for 4 days. Scale bars = 100 μm. b Optimization of the Dox concentration: the cell number relative to the initial cell number and nanovesicle production yield of B16F10 cancer cells after doxorubicin treatment at various concentrations for 4 days. c Optimization of the Dox concentration: antitumor efficacy of SCCNVs produced from cancer cells treated with various doxorubicin concentrations. n = 3–5. d Phosphatidylserine exposure on the B16F10 cancer cell surface after senescence induction with 0.1 μM doxorubicin, as evaluated by flow cytometric analysis. NT no treatment, SC senescence induction. n = 3. mRNA levels of (e) p16 and p21, (f) IFN-γ and TNF-α and (g) protein levels of IFN-γ and TNF-α in B16F10 cancer cells after senescence induction with 0.1 μM doxorubicin. NT no treatment, SC senescence induction. h Transmission electron microscopy image of SCCNVs. Scale bar = 250 nm. i Hydrodynamic diameter of SCCNVs. j Detection of the ovalbumin epitope presented on MHC class I expressed by E.G7-OVA cancer cells by FACS analysis. Following extrusion through nanosized pores, 15% of SCCNVs were positive for the OVA-MHC I complex. pH adjustment enabled the detached OVA in the supernatant to be reloaded on MHC I molecules, increasing the proportion of OVA-MHC I-positive SCCNVs to 96%. Relative (k) mRNA and (l) protein levels of IFN-γ and TNF-α in CCNVs and SCCNVs. m Hydrodynamic diameter of SCCNVs incubated in 10% (v/v) serum-containing buffer for various time periods, showing the colloidal stability of the SCCNVs. ns not significant. Data represent the mean ± SD. Statistical significance was calculated by Student’s t-tests (e, f, and k) or one-way analysis of variance (ANOVA) with Tukey’s multiple comparisons test (a, b, and m). *P < 0.05 versus NT or 0 μM doxorubicin in (af), versus CCNVs in i. †P < 0.05 versus 0.1 μM in a and b, ‡P < 0.05 versus 0.5 μM in b.
Fig. 3
Fig. 3. Effective DC maturation in vitro by SCCNVs.
a In vitro uptake of CCNVs and SCCNVs by DCs for 10 min, as evaluated by flow cytometric analysis. n = 3. b mRNA levels of DC maturation markers (IL-6 and IL-12p40) in BMDCs treated with PBS, CCNV, SCCNV, or LPS for 4 h in vitro, as evaluated by qRT‒PCR. n = 3-4. c Representative flow cytometry plot and percentage of CD80 and CD86 double-positive cells in BMDCs treated with PBS, CCNV, SCCNV, or LPS for 24 h in vitro, evaluated by flow cytometric analysis. n = 4. d Flow cytometric analysis of MHC class I expression of BMDCs treated with PBS, CCNVs, SCCNVs, or LPS for 24 h in vitro, as evaluated by flow cytometric analysis. n = 3. e Flow cytometric analysis showing that the enhanced DC maturation induced by SCCNVs is likely due to IFN-γ and TNF-α contained in SCCNVs. Exogenous IFN-γ and TNF-α were added to the CCNV + IFN-γ + TNF-α group. n = 4. f Effects of various treatments for 24 h on DC maturation, as evaluated by flow cytometric analysis. siRNA-SCCNVs are nanovesicles derived from senescent cancer cells transfected with siRNA specific for IFN-γ and TNF-α. n = 4. In (bf), LPS was used as the positive control. Data represent the mean ± SD. Statistical significance was calculated by Student’s t-tests or one-way ANOVA with Tukey’s multiple comparisons test. *P < 0.05 versus PBS; †P < 0.05 versus CCNVs; ‡P < 0.05 versus SCCNVs in b, c, d and f and versus CCNVs + IFN-γ, TNF-α in e. ns not significant.
Fig. 4
Fig. 4. Effective homing of SCCNVs to lymph nodes, DC maturation in vivo, and SCCNV toxicity.
a Ex vivo imaging at 24 h after intradermal injection of fluorescently labeled CCNVs and SCCNVs. Relative fluorescence was divided by organ mass. n = 4. b Maturation marker expression in dendritic cells in the draining lymph nodes 3 days after intradermal injection of PBS, CCNVs, or SCCNVs, as evaluated by flow cytometric analysis. n = 4–5. c Number of dendritic cells in the draining lymph nodes 7 days after intradermal injection of PBS, CCNVs, or SCCNVs, as evaluated by flow cytometric analysis. n = 3. d mRNA level of CCR7, a representative marker of DC migration to secondary lymphoid organs, in BMDCs treated with PBS, CCNV, SCCNV, or LPS for 24 h in vitro. n = 4. e Serum levels of creatinine, BUN, AST, and ALT in mice treated with intradermal injection of PBS, CCNVs, or SCCNVs three times. n = 4. Statistical significance was calculated by one-way analysis of variance (ANOVA) with Tukey’s multiple comparisons test or two-way analysis of variance with Bonferroni posttests. *P < 0.05 versus CCNVs in a and versus PBS in (bd); †P < 0.05 versus CCNVs in (bd); ‡P < 0.05 versus SCCNVs in d. ns not significant.
Fig. 5
Fig. 5. Effective activation of tumor-specific CD8+ T cells by SCCNVs in vitro and in vivo.
a Flow cytometric analysis of the in vitro proliferation of naïve OT-I CD8 + T cells labeled with CFSE and subsequently cocultured for 72 h with splenic DCs that had been pulsed with PBS, ovalbumin peptide (OVA), CCNVs or SCCNVs. CCNVs and SCCNVs were produced from EL4-cancer cells or E.G7-OVA cancer cells. OVA was used as the positive control. b Timeline for the C57BL/6 mouse immunization study. c Flow cytometric analysis of CD8+ T cells in the PBMCs of mice immunized with intradermal injection of PBS, B16F10 cancer cell-derived CCNVs, or SCCNVs. d Ratio of CD8+/CD3+ T cells in splenocytes harvested from mice that were immunized with PBS, B16F10 cancer cell-derived CCNVs, or SCCNVs and subsequently restimulated in vitro with the gp100 peptide (the tumor antigen of B16F10 cancer cells) for 72 h. e In vitro proliferation of CD8+ T cells during the restimulation of CFSE-labeled splenocytes harvested from mice that had been immunized with PBS, B16F10 cancer cell-derived CCNVs, or SCCNVs. PMA/ionomycin (T-cell activation-inducing agents) served as the positive control. f Levels of IFN-γ and TNF-α, both of which are CD8+ T-cell activation markers, in the culture medium following the in vitro restimulation of splenocytes. The levels of IFN-γ and TNF-α were evaluated with ELISA. g ELISpot analysis of splenocytes harvested from mice immunized with various agents. The number of IFN-γ-producing cells per well was evaluated (n = 4). Statistical significance was calculated by one-way ANOVA with Tukey’s multiple comparisons test. *P < 0.05 versus PBS in (ac) and (eg) or versus PBS, no pg100 in d; †P < 0.05 versus EL4 cancer cell-derived CCNVs in a, versus CCNV in c, e, f and g, and versus PBS, gp100 in d; ‡P < 0.05 versus EL4 cancer cell-derived SCCNVs in (a), versus CCNVs in (d), and versus SCCNV in e, f and g; ‖P < 0.05 versus CCNVs in a; φP < 0.05 versus SCCNVs in a.
Fig. 6
Fig. 6. Therapeutic efficacy of SCCNVs in a therapeutic melanoma murine model and a prophylactic melanoma murine model.
a Therapeutic tumor modeling and vaccination timeline for (bf). b Tumor growth profile. n = 6. c Animal survival rate. n = 6. d TUNEL staining of tumor tissues harvested on Day 15. n = 7. Scale bars = 100 μm. e Immunohistochemical staining for CD8 + T cells in tumor tissues and flow cytometric TIL analysis of tumor tissues harvested on Day 15. n = 6. f Percentage of Treg cells measured in the flow cytometric TIL analysis (n = 4) and immunohistochemical staining for Foxp3 in tumor tissues harvested on Day 15. Scale bars = 50 μm. g Vaccination and prophylactic tumor modeling timeline for (h) and (i). h Tumor growth profile. n = 5. i Animal survival rate. n = 5. Statistical significance was calculated by the log-rank (Mantel–Cox) test (c and i), one-way ANOVA with Tukey’s multiple comparisons test (df) or by two-way ANOVA with Bonferroni posttests (b and h). *P < 0.05 versus PBS; †P < 0.05 versus CCNVs.
Fig. 7
Fig. 7. Inhibition of tumor metastasis by SCCNV injection in murine models.
a Timeline for metastasis modeling of 4T1-Luc tumors with vaccination.b Representative bioluminescence images and c luminescence flux showing tumor metastasis to the lungs in 4T1-Luc tumor cell-inoculated mice at various time points. n = 5–6. d Images of lungs harvested on Day 15 and stained with India ink. Tumor nodules were stained white, and normal lung tissues were stained black. Statistical significance was calculated by two-way ANOVA with Holm‒Sidak posttests. *P < 0.05 versus PBS; †P < 0.05 versus CCNVs; ‡P < 0.05 versus SCCNVs; ‖P < 0.05 versus aPD-L1.
Fig. 8
Fig. 8. Inhibition of postsurgery recurrence of melanoma and 4T1 tumors by SCCNV injection in murine models.
a Timeline of postsurgery recurrence in the B16F10 tumor model for (bd). b Tumor growth profile. n = 13. c Animal survival rate. n = 8. d TUNEL staining of tumor tissues harvested on Day 27. n = 6. Scale bars = 100 μm. e Timeline of postsurgery recurrence in the 4T1 tumor model. f Tumor growth profile. n = 6. Statistical significance was calculated by two-way ANOVA with Bonferroni posttests (b and f), the log-rank (Mantel–Cox) test (c), or one-way ANOVA with Tukey’s multiple comparisons test (d). *P < 0.05 versus PBS; †P < 0.05 versus CCNVs.

Similar articles

Cited by

References

    1. Waldman AD, Fritz JM, Lenardo MJ. A guide to cancer immunotherapy: from T cell basic science to clinical practice. Nat. Rev. Immunol. 2020;20:651–668. doi: 10.1038/s41577-020-0306-5. - DOI - PMC - PubMed
    1. Ghorashian S, et al. Enhanced CAR T cell expansion and prolonged persistence in pediatric patients with ALL treated with a low-affinity CD19 CAR. Nat. Med. 2019;25:1408–1414. doi: 10.1038/s41591-019-0549-5. - DOI - PubMed
    1. Fry TJ, et al. CD22-targeted CAR T cells induce remission in B-ALL that is naive or resistant to CD19-targeted CAR immunotherapy. Nat. Med. 2018;24:20. doi: 10.1038/nm.4441. - DOI - PMC - PubMed
    1. Shin S, et al. Tumor microenvironment modulating functional nanoparticles for effective cancer treatments. Tissue Eng. Regen. Med. 2022;19:205–219. doi: 10.1007/s13770-021-00403-7. - DOI - PMC - PubMed
    1. Morse MA, Gwin WR, Mitchell DA. Vaccine therapies for cancer: then and now. Target. Oncol. 2021;16:1–32. doi: 10.1007/s11523-020-00788-w. - DOI - PMC - PubMed

Publication types