Large haplotypes highlight a complex age structure within the maize pan-genome
- PMID: 36854668
- PMCID: PMC10078284
- DOI: 10.1101/gr.276705.122
Large haplotypes highlight a complex age structure within the maize pan-genome
Abstract
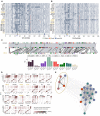
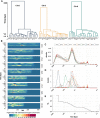
The genomes of maize and other eukaryotes contain stable haplotypes in regions of low recombination. These regions, including centromeres, long heterochromatic blocks, and rDNA arrays, have been difficult to analyze with respect to their diversity and origin. Greatly improved genome assemblies are now available that enable comparative genomics over these and other nongenic spaces. Using 26 complete maize genomes, we developed methods to align intergenic sequences while excluding genes and regulatory regions. The centromere haplotypes (cenhaps) extend for megabases on either side of the functional centromere regions and appear as evolutionary strata, with haplotype divergence/coalescence times dating as far back as 450 thousand years ago (kya). Application of the same methods to other low recombination regions (heterochromatic knobs and rDNA) and all intergenic spaces revealed that deep coalescence times are ubiquitous across the maize pan-genome. Divergence estimates vary over a broad timescale with peaks at ∼16 and 300 kya, reflecting a complex history of gene flow among diverging populations and changes in population size associated with domestication. Cenhaps and other long haplotypes provide vivid displays of this ancient diversity.
© 2023 Liu and Dawe; Published by Cold Spring Harbor Laboratory Press.
Figures


Similar articles
-
Haplotypes spanning centromeric regions reveal persistence of large blocks of archaic DNA.Elife. 2019 Jun 25;8:e42989. doi: 10.7554/eLife.42989. Elife. 2019. PMID: 31237235 Free PMC article.
-
JunctionViewer: customizable annotation software for repeat-rich genomic regions.BMC Bioinformatics. 2010 Jan 12;11:23. doi: 10.1186/1471-2105-11-23. BMC Bioinformatics. 2010. PMID: 20067643 Free PMC article.
-
Gapless assembly of maize chromosomes using long-read technologies.Genome Biol. 2020 May 20;21(1):121. doi: 10.1186/s13059-020-02029-9. Genome Biol. 2020. PMID: 32434565 Free PMC article.
-
The maize abnormal chromosome 10 meiotic drive haplotype: a review.Chromosome Res. 2022 Sep;30(2-3):205-216. doi: 10.1007/s10577-022-09693-6. Epub 2022 Jun 2. Chromosome Res. 2022. PMID: 35652970 Review.
-
Complex structure of knobs and centromeric regions in maize chromosomes.Tsitol Genet. 2000 Mar-Apr;34(2):11-5. Tsitol Genet. 2000. PMID: 10857197 Review.
Cited by
-
Exploring Pan-Genomes: An Overview of Resources and Tools for Unraveling Structure, Function, and Evolution of Crop Genes and Genomes.Biomolecules. 2023 Sep 17;13(9):1403. doi: 10.3390/biom13091403. Biomolecules. 2023. PMID: 37759803 Free PMC article. Review.
-
Genomics of plant speciation.Plant Commun. 2023 Sep 11;4(5):100599. doi: 10.1016/j.xplc.2023.100599. Epub 2023 Apr 11. Plant Commun. 2023. PMID: 37050879 Free PMC article. Review.
References
-
- Abouelhoda MI, Ohlebusch E. 2005. Chaining algorithms for multiple genome comparison. J Discrete Algorithms 3: 321–341. 10.1016/j.jda.2004.08.011 - DOI
-
- Ardelean CF, Becerra-Valdivia L, Pedersen MW, Schwenninger J-L, Oviatt CG, Macías-Quintero JI, Arroyo-Cabrales J, Sikora M, Ocampo-Díaz YZE, Rubio-Cisneros II, et al. 2020. Evidence of human occupation in Mexico around the last glacial maximum. Nature 584: 87–92. 10.1038/s41586-020-2509-0 - DOI - PubMed
Publication types
MeSH terms
LinkOut - more resources
Full Text Sources
