

Protonated Forms of Naringenin and Naringenin Chalcone: Proteiform Bioactive Species Elucidated by IRMPD Spectroscopy, IMS, CID-MS, and Computational Approaches
- PMID: 36849438
- PMCID: PMC9999425
- DOI: 10.1021/acs.jafc.2c07453
Protonated Forms of Naringenin and Naringenin Chalcone: Proteiform Bioactive Species Elucidated by IRMPD Spectroscopy, IMS, CID-MS, and Computational Approaches
Abstract
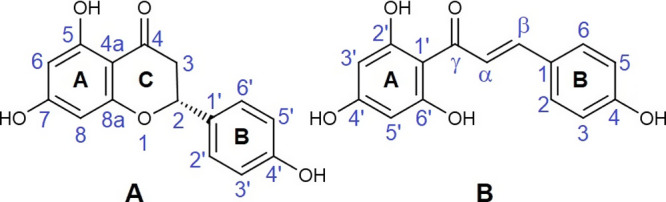
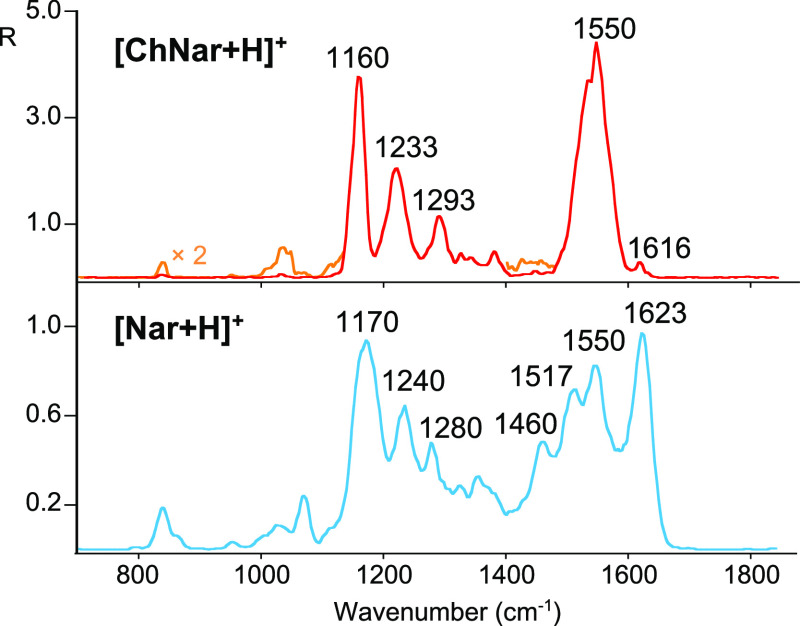
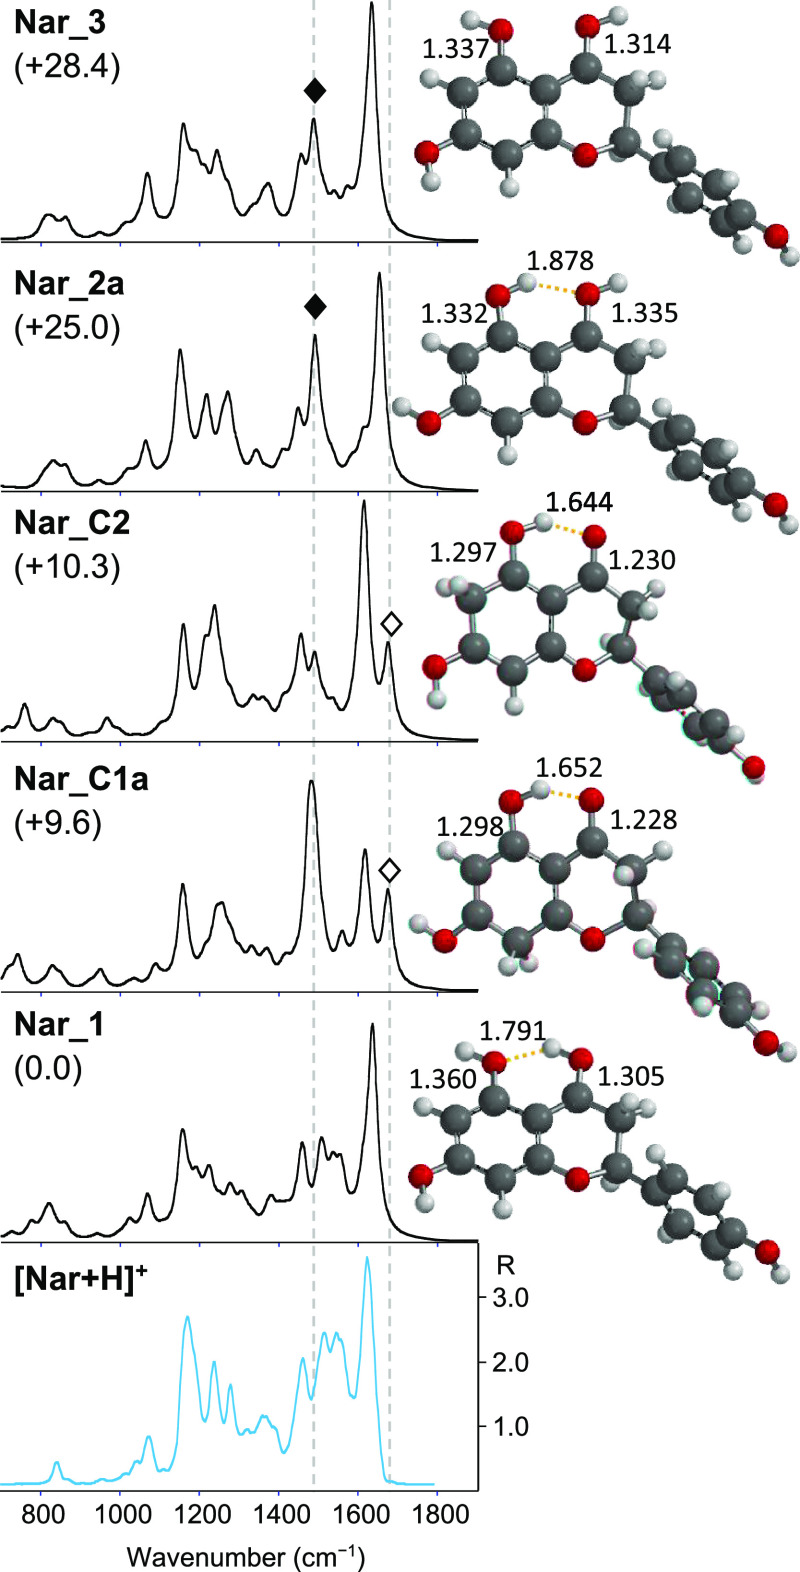
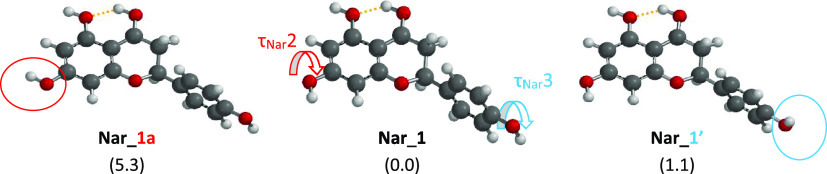
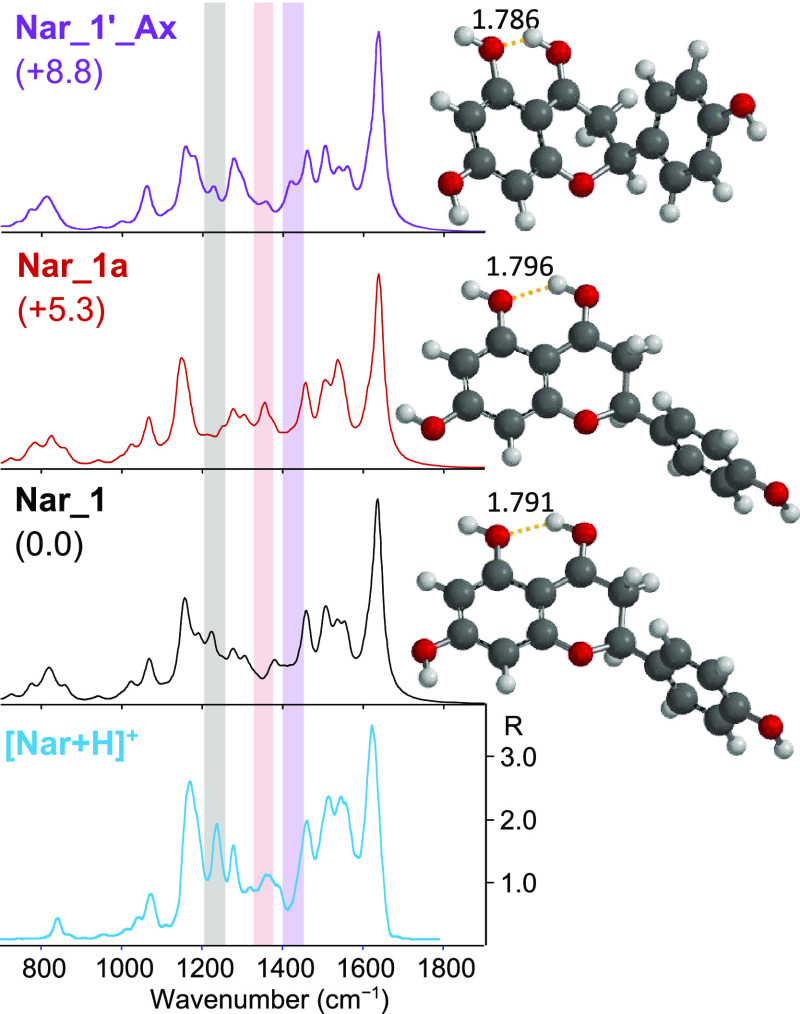
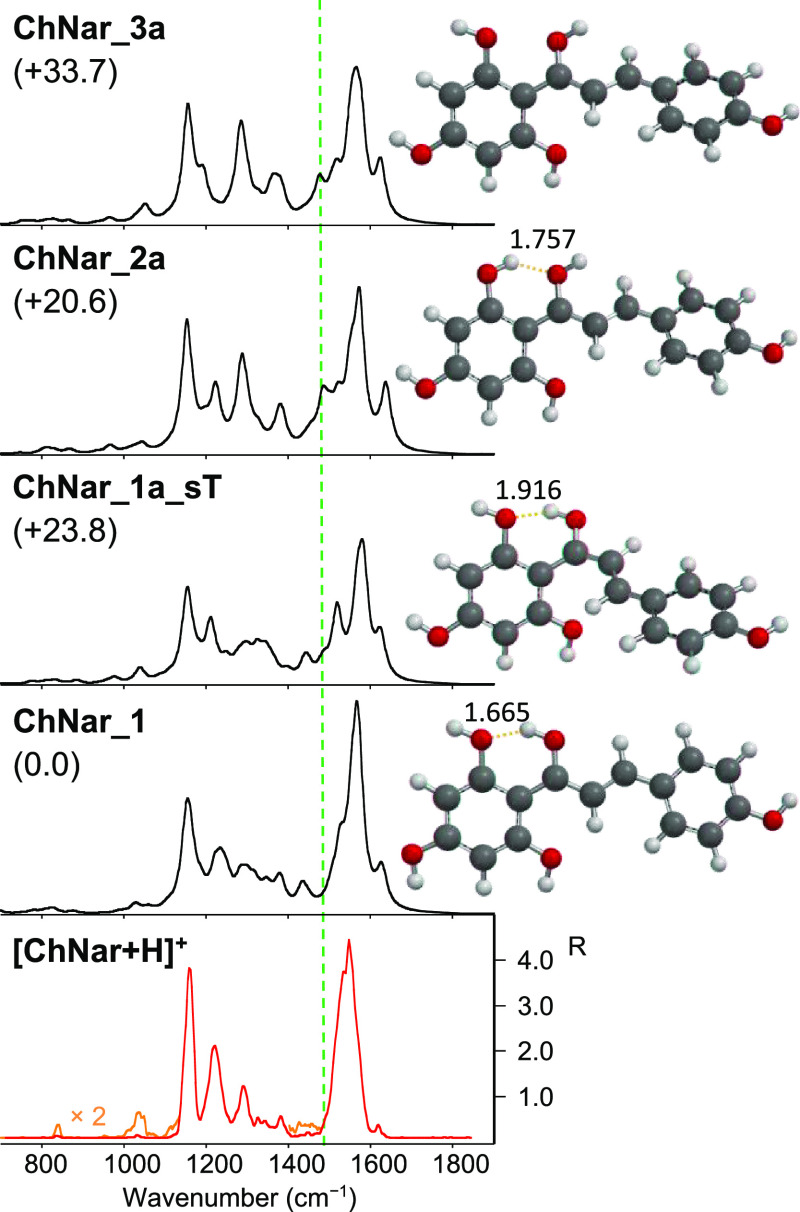
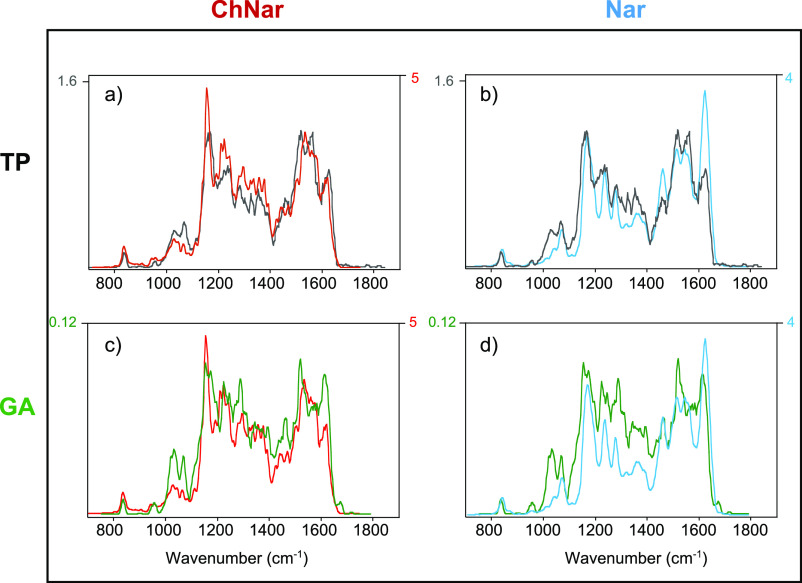
Naringenin (Nar) and its structural isomer, naringenin chalcone (ChNar), are two natural phytophenols with beneficial health effects belonging to the flavonoids family. A direct discrimination and structural characterization of the protonated forms of Nar and ChNar, delivered into the gas phase by electrospray ionization (ESI), was performed by mass spectrometry-based methods. In this study, we exploit a combination of electrospray ionization coupled to (high-resolution) mass spectrometry (HR-MS), collision-induced dissociation (CID) measurements, IR multiple-photon dissociation (IRMPD) action spectroscopy, density functional theory (DFT) calculations, and ion mobility-mass spectrometry (IMS). While IMS and variable collision-energy CID experiments hardly differentiate the two isomers, IRMPD spectroscopy appears to be an efficient method to distinguish naringenin from its related chalcone. In particular, the spectral range between 1400 and 1700 cm-1 is highly specific in discriminating between the two protonated isomers. Selected vibrational signatures in the IRMPD spectra have allowed us to identify the nature of the metabolite present in methanolic extracts of commercial tomatoes and grapefruits. Furthermore, comparisons between experimental IRMPD and calculated IR spectra have clarified the geometries adopted by the two protonated isomers, allowing a conformational analysis of the probed species.
Keywords: IRMPD action spectroscopy; conformational analysis; flavanones; isomeric discrimination; naringenin; structural elucidation; tandem mass spectrometry.
Conflict of interest statement
The authors declare no competing financial interest.
Figures
Similar articles
-
Structural characterization by infrared multiple photon dissociation spectroscopy of protonated gas-phase ions obtained by electrospray ionization of cysteine and dopamine.Anal Bioanal Chem. 2011 Mar;399(7):2463-73. doi: 10.1007/s00216-010-4582-y. Epub 2011 Jan 27. Anal Bioanal Chem. 2011. PMID: 21271241
-
An investigation of protonation sites and conformations of protonated amino acids by IRMPD spectroscopy.Chemphyschem. 2008 Dec 22;9(18):2826-35. doi: 10.1002/cphc.200800543. Chemphyschem. 2008. PMID: 18846594
-
5-Halogenation of Uridine Suppresses Protonation-Induced Tautomerization and Enhances Glycosidic Bond Stability of Protonated Uridine: Investigations via IRMPD Action Spectroscopy, ER-CID Experiments, and Theoretical Calculations.J Am Soc Mass Spectrom. 2022 Nov 2;33(11):2165-2180. doi: 10.1021/jasms.2c00231. Epub 2022 Oct 24. J Am Soc Mass Spectrom. 2022. PMID: 36279168
-
Mass spectrometry hybridized with gas-phase InfraRed spectroscopy for glycan sequencing.Curr Opin Struct Biol. 2020 Jun;62:121-131. doi: 10.1016/j.sbi.2019.12.014. Epub 2020 Jan 22. Curr Opin Struct Biol. 2020. PMID: 31981952 Review.
-
Activation of large ions in FT-ICR mass spectrometry.Mass Spectrom Rev. 2005 Mar-Apr;24(2):135-67. doi: 10.1002/mas.20012. Mass Spectrom Rev. 2005. PMID: 15389858 Review.
References
MeSH terms
Substances
LinkOut - more resources
Full Text Sources
