

Targeting Glutaminolysis Shows Efficacy in Both Prednisolone-Sensitive and in Metabolically Rewired Prednisolone-Resistant B-Cell Childhood Acute Lymphoblastic Leukaemia Cells
- PMID: 36834787
- PMCID: PMC9965631
- DOI: 10.3390/ijms24043378
Targeting Glutaminolysis Shows Efficacy in Both Prednisolone-Sensitive and in Metabolically Rewired Prednisolone-Resistant B-Cell Childhood Acute Lymphoblastic Leukaemia Cells
Abstract
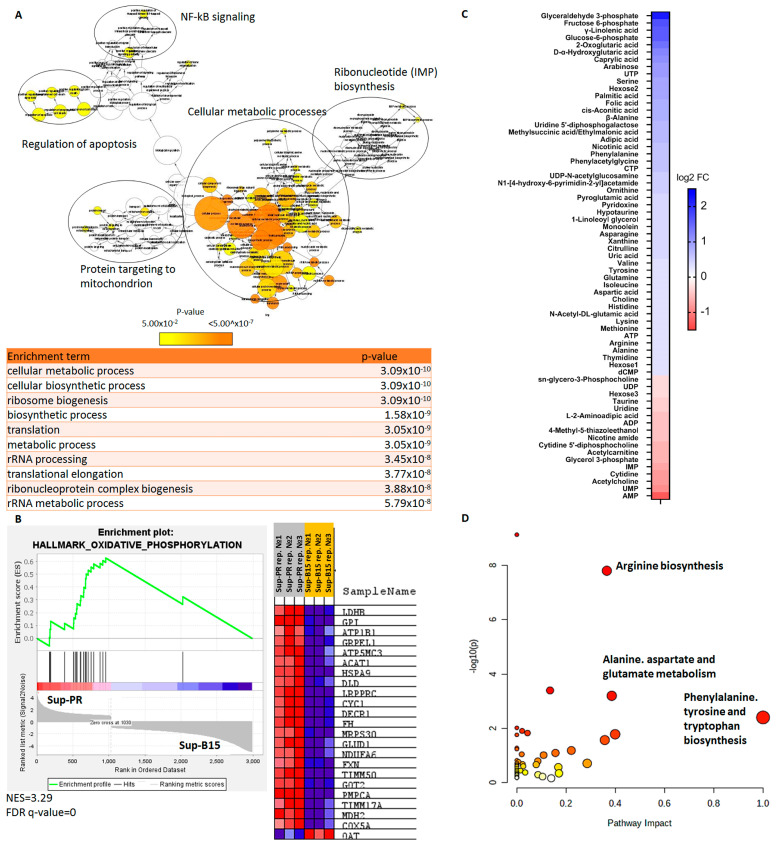
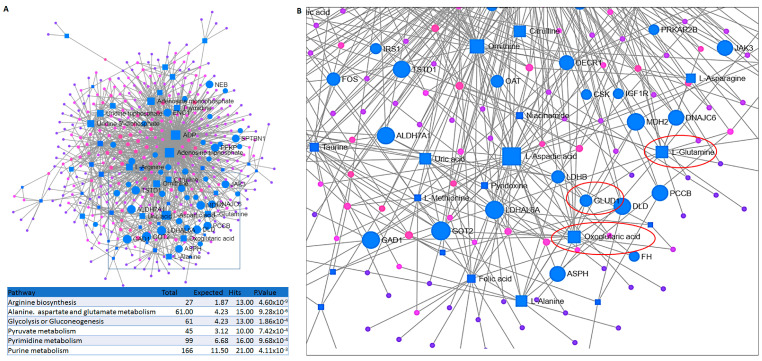
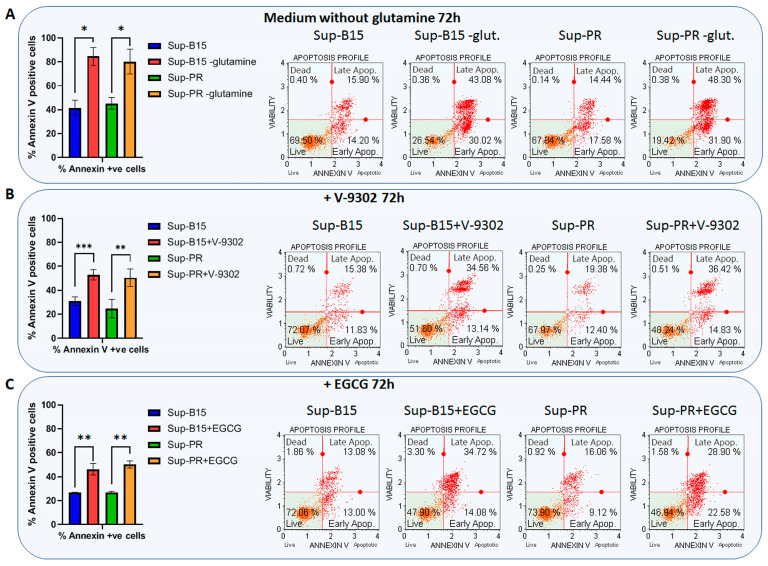
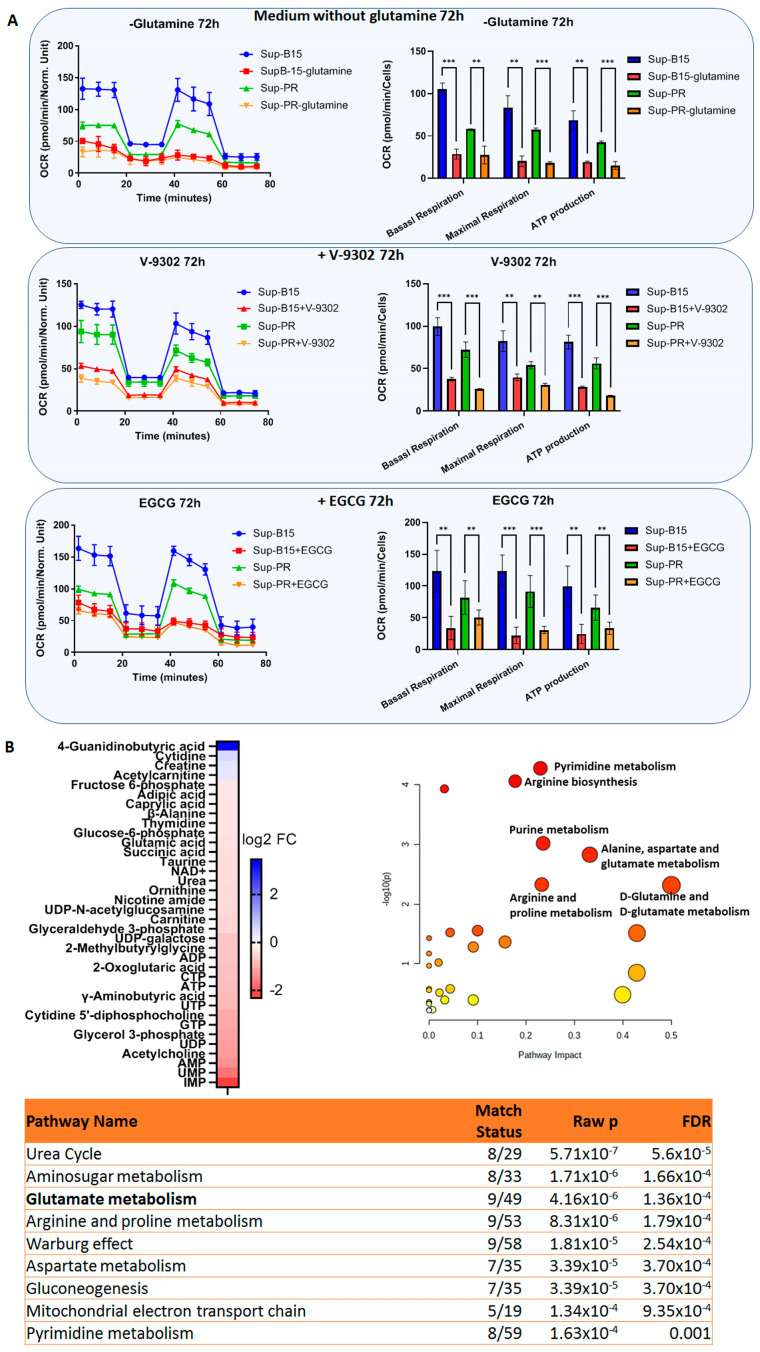
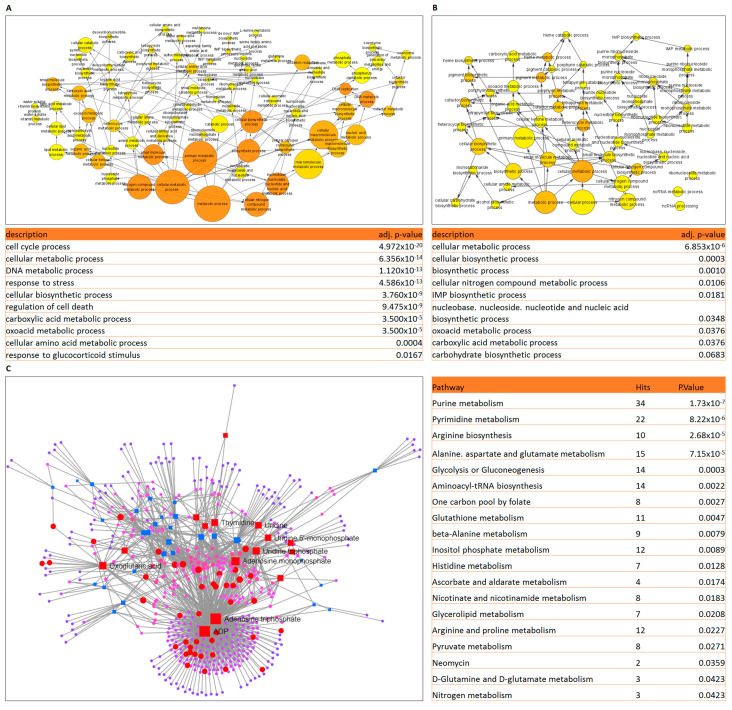
The prognosis for patients with relapsed childhood acute lymphoblastic leukaemia (cALL) remains poor. The main reason for treatment failure is drug resistance, most commonly to glucocorticoids (GCs). The molecular differences between prednisolone-sensitive and -resistant lymphoblasts are not well-studied, thereby precluding the development of novel and targeted therapies. Therefore, the aim of this work was to elucidate at least some aspects of the molecular differences between matched pairs of GC-sensitive and -resistant cell lines. To address this, we carried out an integrated transcriptomic and metabolomic analysis, which revealed that lack of response to prednisolone may be underpinned by alterations in oxidative phosphorylation, glycolysis, amino acid, pyruvate and nucleotide biosynthesis, as well as activation of mTORC1 and MYC signalling, which are also known to control cell metabolism. In an attempt to explore the potential therapeutic effect of inhibiting one of the hits from our analysis, we targeted the glutamine-glutamate-α-ketoglutarate axis by three different strategies, all of which impaired mitochondrial respiration and ATP production and induced apoptosis. Thereby, we report that prednisolone resistance may be accompanied by considerable rewiring of transcriptional and biosynthesis programs. Among other druggable targets that were identified in this study, inhibition of glutamine metabolism presents a potential therapeutic approach in GC-sensitive, but more importantly, in GC-resistant cALL cells. Lastly, these findings may be clinically relevant in the context of relapse-in publicly available datasets, we found gene expression patterns suggesting that in vivo drug resistance is characterised by similar metabolic dysregulation to what we found in our in vitro model.
Keywords: EGCG (epigallocatechin gallate); V-9302; childhood ALL; glucocorticoids; glutamine; glutaminolysis; metabolism; metabolomics; prednisolone; resistance.
Conflict of interest statement
The authors declare no conflict of interest.
Figures
Similar articles
-
Combination of prednisolone and low dosed dexamethasone exhibits greater in vitro antileukemic activity than equiactive dose of prednisolone and overcomes prednisolone drug resistance in acute childhood lymphoblastic leukemia.Biomed Pap Med Fac Univ Palacky Olomouc Czech Repub. 2014 Sep;158(3):422-7. doi: 10.5507/bp.2012.059. Epub 2012 Oct 31. Biomed Pap Med Fac Univ Palacky Olomouc Czech Repub. 2014. PMID: 23128824
-
Bortezomib Treatment can Overcome Glucocorticoid Resistance in Childhood B-cell Precursor Acute Lymphoblastic Leukemia Cell Lines.Klin Padiatr. 2015 May;227(3):123-30. doi: 10.1055/s-0034-1398628. Epub 2015 May 18. Klin Padiatr. 2015. PMID: 25985447
-
Inhibition of glycolysis modulates prednisolone resistance in acute lymphoblastic leukemia cells.Blood. 2009 Feb 26;113(9):2014-21. doi: 10.1182/blood-2008-05-157842. Epub 2008 Oct 31. Blood. 2009. PMID: 18978206 Free PMC article.
-
Gene Expression and Resistance to Glucocorticoid-Induced Apoptosis in Acute Lymphoblastic Leukemia: A Brief Review and Update.Curr Drug Res Rev. 2020;12(2):131-149. doi: 10.2174/2589977512666200220122650. Curr Drug Res Rev. 2020. PMID: 32077838 Review.
-
Glucocorticoid resistance in paediatric acute lymphoblastic leukaemia.J Paediatr Child Health. 2012 Aug;48(8):634-40. doi: 10.1111/j.1440-1754.2011.02212.x. Epub 2011 Nov 3. J Paediatr Child Health. 2012. PMID: 22050419 Review.
Cited by
-
Metabolic regulation of the immune system in health and diseases: mechanisms and interventions.Signal Transduct Target Ther. 2024 Oct 9;9(1):268. doi: 10.1038/s41392-024-01954-6. Signal Transduct Target Ther. 2024. PMID: 39379377 Free PMC article. Review.
-
Metabolic Fingerprint in Childhood Acute Lymphoblastic Leukemia.Diagnostics (Basel). 2024 Mar 24;14(7):682. doi: 10.3390/diagnostics14070682. Diagnostics (Basel). 2024. PMID: 38611595 Free PMC article.
-
The roles of epigallocatechin gallate in the tumor microenvironment, metabolic reprogramming, and immunotherapy.Front Immunol. 2024 Jan 29;15:1331641. doi: 10.3389/fimmu.2024.1331641. eCollection 2024. Front Immunol. 2024. PMID: 38348027 Free PMC article. Review.
References
MeSH terms
Substances
Grants and funding
LinkOut - more resources
Full Text Sources
Molecular Biology Databases
Miscellaneous
