Imaging Methods Applicable in the Diagnostics of Alzheimer's Disease, Considering the Involvement of Insulin Resistance
- PMID: 36834741
- PMCID: PMC9958721
- DOI: 10.3390/ijms24043325
Imaging Methods Applicable in the Diagnostics of Alzheimer's Disease, Considering the Involvement of Insulin Resistance
Abstract
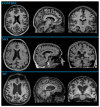
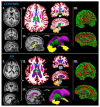
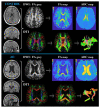
Alzheimer's disease (AD) is an incurable neurodegenerative disease and the most frequently diagnosed type of dementia, characterized by (1) perturbed cerebral perfusion, vasculature, and cortical metabolism; (2) induced proinflammatory processes; and (3) the aggregation of amyloid beta and hyperphosphorylated Tau proteins. Subclinical AD changes are commonly detectable by using radiological and nuclear neuroimaging methods such as magnetic resonance imaging (MRI), computed tomography (CT), positron emission tomography (PET), and single-photon emission computed tomography (SPECT). Furthermore, other valuable modalities exist (in particular, structural volumetric, diffusion, perfusion, functional, and metabolic magnetic resonance methods) that can advance the diagnostic algorithm of AD and our understanding of its pathogenesis. Recently, new insights into AD pathoetiology revealed that deranged insulin homeostasis in the brain may play a role in the onset and progression of the disease. AD-related brain insulin resistance is closely linked to systemic insulin homeostasis disorders caused by pancreas and/or liver dysfunction. Indeed, in recent studies, linkages between the development and onset of AD and the liver and/or pancreas have been established. Aside from standard radiological and nuclear neuroimaging methods and clinically fewer common methods of magnetic resonance, this article also discusses the use of new suggestive non-neuronal imaging modalities to assess AD-associated structural changes in the liver and pancreas. Studying these changes might be of great clinical importance because of their possible involvement in AD pathogenesis during the prodromal phase of the disease.
Keywords: Alzheimer’s disease; diffusion magnetic resonance; functional magnetic resonance; insulin resistance; liver; magnetic resonance spectroscopy; magnetic resonance volumetry; neuroimaging; pancreas; perfusion magnetic resonance; positron emission tomography.
Conflict of interest statement
The funders had no role in the design of the study; in the collection, analyses, or interpretation of data; in the writing of the manuscript; or in the decision to publish the results.
Figures


Similar articles
-
Optimizing Use of Neuroimaging Tools in Evaluation of Prodromal Alzheimer's Disease and Related Disorders.J Alzheimers Dis. 2020;77(3):935-947. doi: 10.3233/JAD-200487. J Alzheimers Dis. 2020. PMID: 32804147 Review.
-
Imaging discrepancies between magnetic resonance imaging and brain perfusion single-photon emission computed tomography in the diagnosis of Alzheimer's disease, and verification with amyloid positron emission tomography.Psychogeriatrics. 2014 Jun;14(2):110-7. doi: 10.1111/psyg.12047. Psychogeriatrics. 2014. PMID: 24954834
-
Accuracy of Tau Positron Emission Tomography as a Prognostic Marker in Preclinical and Prodromal Alzheimer Disease: A Head-to-Head Comparison Against Amyloid Positron Emission Tomography and Magnetic Resonance Imaging.JAMA Neurol. 2021 Aug 1;78(8):961-971. doi: 10.1001/jamaneurol.2021.1858. JAMA Neurol. 2021. PMID: 34180956 Free PMC article.
-
Contribution of neuroimaging to the diagnosis of Alzheimer's disease and vascular dementia.Arch Med Res. 2012 Nov;43(8):671-6. doi: 10.1016/j.arcmed.2012.10.018. Epub 2012 Nov 8. Arch Med Res. 2012. PMID: 23142262 Review.
-
Neuroimaging and other modalities to assess Alzheimer's disease in Down syndrome.Neuroimage Clin. 2017 Nov 6;17:263-271. doi: 10.1016/j.nicl.2017.10.022. eCollection 2018. Neuroimage Clin. 2017. PMID: 29159043 Free PMC article. Review.
Cited by
-
Iron accumulation/overload and Alzheimer's disease risk factors in the precuneus region: A comprehensive narrative review.Aging Med (Milton). 2024 Oct 22;7(5):649-667. doi: 10.1002/agm2.12363. eCollection 2024 Oct. Aging Med (Milton). 2024. PMID: 39507230 Free PMC article. Review.
-
Insulin resistance, bone health, and fracture risk.Osteoporos Int. 2024 Nov;35(11):1909-1917. doi: 10.1007/s00198-024-07227-w. Epub 2024 Sep 12. Osteoporos Int. 2024. PMID: 39264439 Review.
References
Publication types
MeSH terms
Substances
Grants and funding
LinkOut - more resources
Full Text Sources
Medical

