. 2023 Feb 2:17:1111263.
doi: 10.3389/fncel.2023.1111263. eCollection 2023.

Angiotensin II increases respiratory rhythmic activity in the preBötzinger complex without inducing astroglial calcium signaling

Affiliations

Angiotensin II increases respiratory rhythmic activity in the preBötzinger complex without inducing astroglial calcium signaling

Charlotte Tacke et al. Front Cell Neurosci. .

Abstract

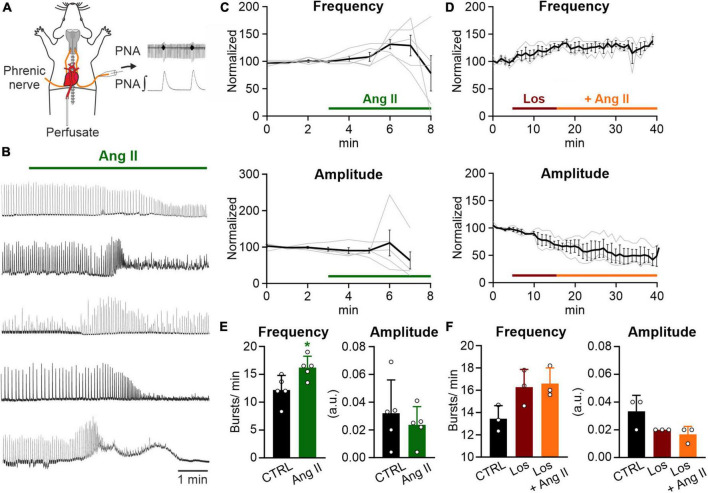
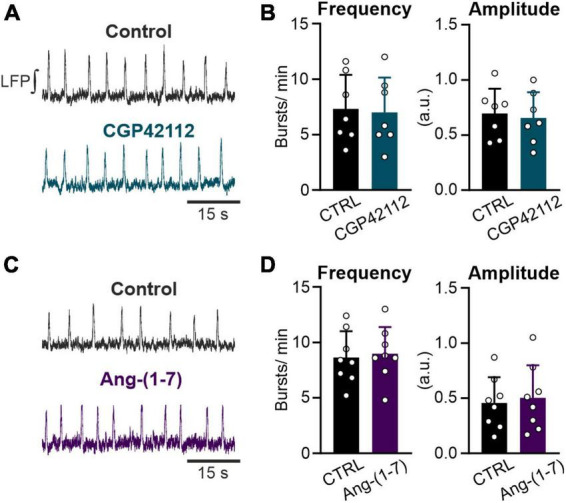
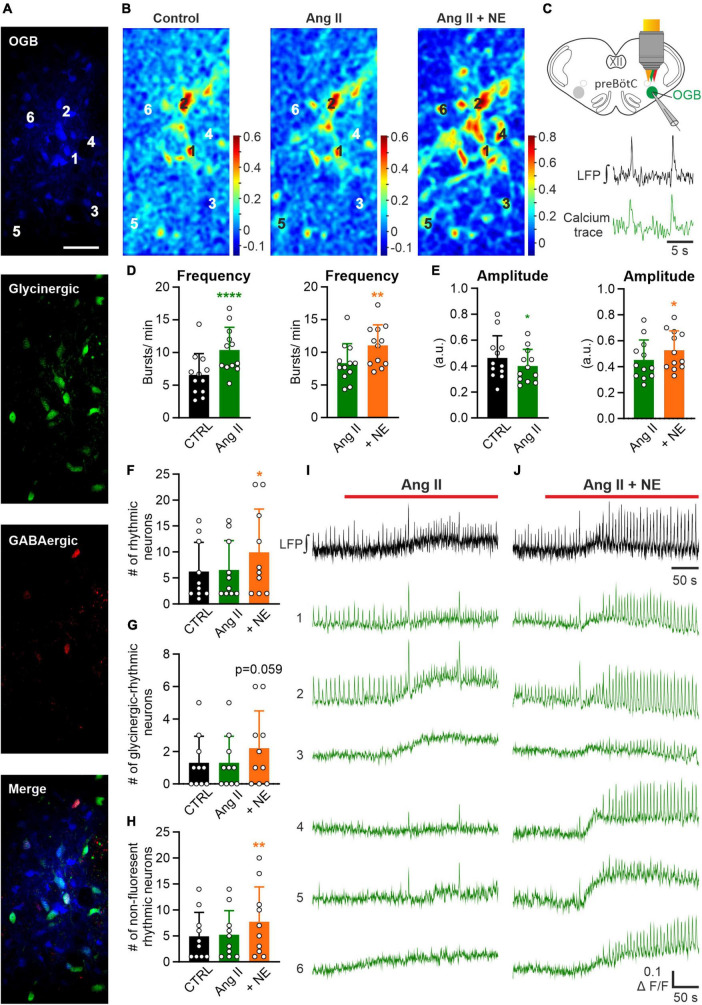
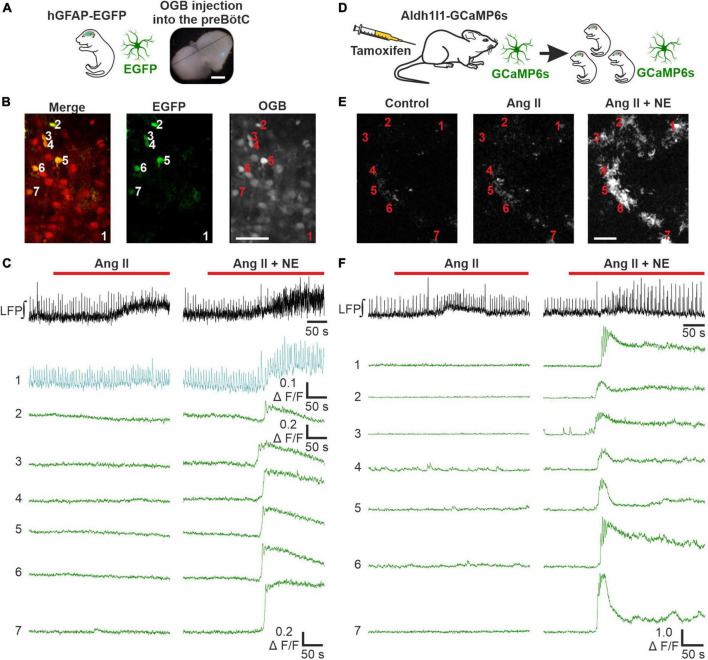
Angiotensin II (Ang II) is the primary modulator of the renin-angiotensin system and has been widely studied for its effect on the cardiovascular system. While a few studies have also indicated an involvement of Ang II in the regulation of breathing, very little is known in this regard and its effect on brainstem respiratory regions such as the preBötzinger complex (preBötC), the kernel for inspiratory rhythm generation, has not been investigated yet. This study reports that Ang II temporarily increases phrenic nerve activity in the working heart-brainstem preparation, indicating higher central respiratory drive. Previous studies have shown that the carotid body is involved in mediating this effect and we revealed that the preBötC also plays a part, using acute slices of the brainstem. It appears that Ang II is increasing the respiratory drive in an AT1R-dependent manner by optimizing the interaction of inhibitory and excitatory neurons of the preBötC. Thus, Ang II-mediated effects on the preBötC are potentially involved in dysregulating breathing in patients with acute lung injury.

Keywords: angiotensin II; astrocytes; preBötzinger complex (preBötC); respiration; respiratory activity.


Conflict of interest statement

The authors declare that the research was conducted in the absence of any commercial or financial relationships that could be construed as a potential conflict of interest.

Figures

FIGURE 1
FIGURE 1
Ang II increases respiratory rate in the WHBP. (A) Illustration of the working heart-brainstem preparation (WHBP) showing recordings of phrenic nerve activity (PNA). (B) Recordings of the integrated PNA in response to Angiotensin II (Ang II) treatment. (C,D) Graphs show the frequency and amplitude of PNA over time. Signals after treatment were normalized to the baseline (control condition). Gray traces show each individual recording and the black trace the mean value. (C) Treatment with Ang II alone (100–500 nM; N = 5 mice, 3 male and 2 female) and (D) a 12 min pre-treatment with losartan (Los; 5 μM) followed by the co-application of Ang II (500 nM; N = 3 female mice). (E) Charts show the averaged data of 2 min time intervals for the different conditions for frequency and amplitude (CTRL 1–3 min, Ang II 6–8 min). (F) Charts show the averaged data of a 3 min time interval for CTRL and a 5 min time interval for the other two conditions (CTRL 2–5 min, Los 12–17 min, and Ang II 21–26 min). The data are presented as mean ± SD and were tested using a (E) paired Student’s t-test or (F) Friedman test. *p < 0.05.
FIGURE 2
FIGURE 2
Ang II modulates rhythmic activity in the preBötC. Local field potential (LFP) recordings were performed in the preBötC in rhythmic acute brainstem slices (600 μm) from mice (P4–P12). (A) Schematic drawing of a brainstem slice with the preBötC marked in red (NA: nucleus ambiguus, IO: inferior olive) and an acute slice with the recording electrode placed in the preBötC. Scale bar 1 mm. (B) Example traces of the recorded (upper traces) and integrated (lower traces) LFP for each condition. Basic rhythmic activity was recorded for 15 min (control), followed by a 20 min Ang II treatment and a 40 min washout. (C) Recordings over time. Data after application of Ang II (500 nM) was normalized to the baseline (control condition). Gray traces show each individual recording (N = 10 slices) and the black trace the mean value. (D) Charts show the averaged data of 5 min intervals for the different conditions (CTRL 10–15 min, Ang II 20–25 min, Washout 70–75 min). The data are presented as mean ± SD and were tested using a RM one-way ANOVA. ***p < 0.001. (E) Dose-Response graph of 2.5 nM (N = 7 slices), 5 nM (N = 6 slices), and 500 nM Ang II. The frequency was used for this evaluation.
FIGURE 3
FIGURE 3
Ang II increases rhythmic activity in an AT1R-dependent manner. LFP recordings in the preBötC in rhythmic acute brainstem slices. (A,C) Example traces of the integrated LFP for each condition. Control condition was recorded for 15 min followed by a 20 min treatment, except (C) where losartan (Los; 5 μM) was pre-applied for 10 min. (B,D) Charts show the averaged data of 5 min intervals. CTRL 10–15 min, (B) Ang II + Los 20–25 min, (D) Los 20–25 min, Los + Ang II 30–35 min. (B) N = 5 slices and (D) N = 8 slices. The data are presented as mean ± SD and were tested using a (B) paired Student’s t-test or (D) a RM one-way ANOVA. *p < 0.05; ***p < 0.001.
FIGURE 4
FIGURE 4
Both the AT2R and the MasR do not modulate respiratory rate. LFP recordings in the preBötC in rhythmic acute brainstem slices. (A,C) Example traces of the integrated LFP for each condition. Control condition was recorded for 15 min followed by a 20 min treatment with (A,B) the AT2R agonist CGP42112 (500 nM) and (C,D) the MasR agonist Ang-(1–7) (10 nM). (B,D) Charts show the averaged data of 5 min intervals (CTRL 10–15 min and treatment 30–35 min). (B) N = 7 slices and (D) N = 8 slices. The data are presented as mean ± SD and were tested using a paired Student’s t-test.
FIGURE 5
FIGURE 5
Effect of Ang II is not mediated by recruitment of additional rhythmic neurons. LFP recordings were combined with 2P microscopy in acute rhythmic slices. Oregon Green 488 BAPTA-1AM (OGB) was pressure injected into the preBötC. (A) Images of neurons loaded with OGB from COFLOUR mice expressing EGFP in glycinergic and tdTomato in GABAergic interneurons. Scale bar 50 μm. (B) Cross-correlation maps of the LFP and calcium responses for the different treatment groups. Norepinephrine (NE; 10 μM) was added to Ang II. (C) Schematic drawing of an OGB injected slice, showing LFP and calcium traces of a rhythmic neuron below. (D,E) The baseline of the LFP was recorded for 5 min before the treatment was applied. Charts show averaged LFP data from imaging experiments (control condition was recorded for 3 min–time interval 2–5 min and the treatment groups for 4 min–time interval 8–12 min), N = 12 slices. (F) Chart shows the mean number of all rhythmic neurons, which is then divided into (G) glycinergic-rhythmic and (H) non-fluorescent rhythmic neurons. N = 10 slices. The data are presented as mean ± SD and were tested using a (D,E) paired Student’s t-test or a (F–H) RM one-way ANOVA. *p < 0.05; **p < 0.01; ****p < 0.0001. (I,J) LFP (black) and calcium traces (green) from selected neurons (A) treated with Ang II and Ang II + NE.
FIGURE 6
FIGURE 6
Ang II does not lead to an increase in intracellular calcium in astrocytes. LFP recordings were combined with 2P microscopy in acute rhythmic slices. Two mouse models were used to investigate the effect of Ang II on astrocytes. (A–C) Acute slices of mice expressing EGFP in astrocytes were injected with OGB. (A) Scale bar 1 mm. (B) Exemplary images for EGFP and OGB. (D–F) Mice expressing GCaMP6s in astrocytes conditionally, were injected with tamoxifen on two consecutive days postpartum. The pups receive tamoxifen through the mother’s milk, allowing direct calcium-imaging of astrocytes. The numbers in the images (B,E) indicate the cells for which the calcium-traces are shown (C,F). (B,E) Scale bars 50 μm. (C,F) Co-treatment with norepinephrine (NE) served as a positive control after the Ang II application. (A–C) N = 11 slices, n = 70 astrocytes and (D–F) N = 9 slices, n = 160 astrocytes.

Similar articles

Cited by

References

    1. Aguirre J. A., Covenas R., Croix D., Alonso J. R., Narvaez J. A., Tramu G., et al. (1989). Immunocytochemical study of angiotensin-II fibres and cell bodies in the brainstem respiratory areas of the cat. Brain Res. 489 311–317. 10.1016/0006-8993(89)90864-0 - DOI - PubMed
    1. Allen A. M. (1998). Angiotensin AT1 receptor-mediated excitation of rat carotid body chemoreceptor afferent activity. J. Physiol. 510 773–781. 10.1111/j.1469-7793.1998.773bj.x - DOI - PMC - PubMed
    1. Allen A. M., Moeller I., Jenkins T. A., Zhuo J., Aldred G. P., Chai S. Y., et al. (1998). Angiotensin receptors in the nervous system. Brain Res. Bull. 47 17–28. 10.1016/s0361-9230(98)00039-2 - DOI - PubMed
    1. Baertsch N. A., Baertsch H. C., Ramirez J. M. (2018). The interdependence of excitation and inhibition for the control of dynamic breathing rhythms. Nat. Commun. 9:843. 10.1038/s41467-018-03223-x - DOI - PMC - PubMed
    1. Baltatu O., Silva J. A., Jr., Ganten D., Bader M. (2000). The brain renin-angiotensin system modulates angiotensin II-induced hypertension and cardiac hypertrophy. Hypertension 35 409–412. 10.1161/01.hyp.35.1.409 - DOI - PubMed

Grants and funding

This work was supported by the Deutsche Forschungsgemeinschaft to SH (HU 797/13-1).

LinkOut - more resources