

Normalized L3-based link prediction in protein-protein interaction networks
- PMID: 36814208
- PMCID: PMC9945744
- DOI: 10.1186/s12859-023-05178-3
Normalized L3-based link prediction in protein-protein interaction networks
Abstract
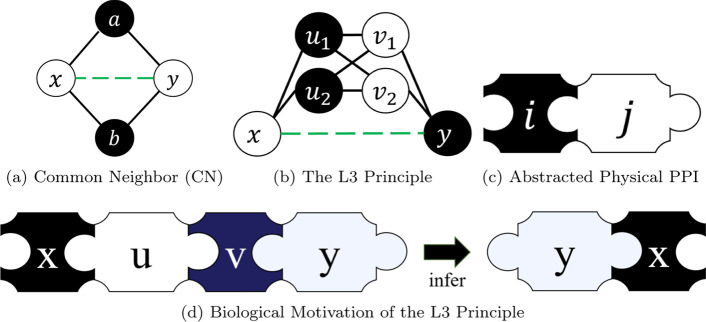
Background: Protein-protein interaction (PPI) data is an important type of data used in functional genomics. However, high-throughput experiments are often insufficient to complete the PPI interactome of different organisms. Computational techniques are thus used to infer missing data, with link prediction being one such approach that uses the structure of the network of PPIs known so far to identify non-edges whose addition to the network would make it more sound, according to some underlying assumptions. Recently, a new idea called the L3 principle introduced biological motivation into PPI link predictions, yielding predictors that are superior to general-purpose link predictors for complex networks. Interestingly, the L3 principle can be interpreted in another way, so that other signatures of PPI networks can also be characterized for PPI predictions. This alternative interpretation uncovers candidate PPIs that the current L3-based link predictors may not be able to fully capture, underutilizing the L3 principle.
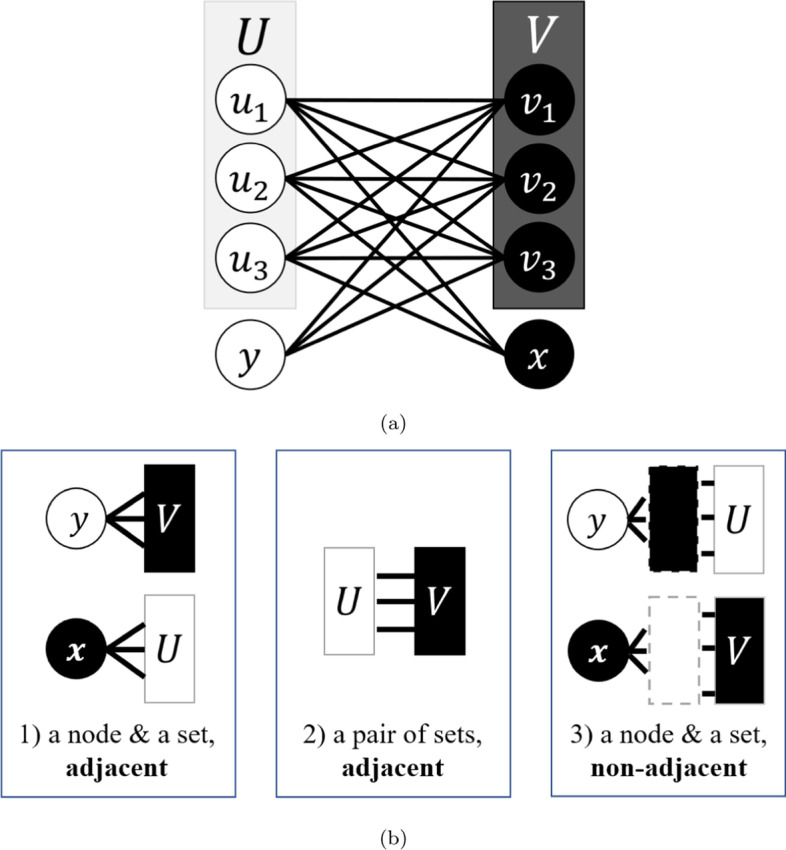
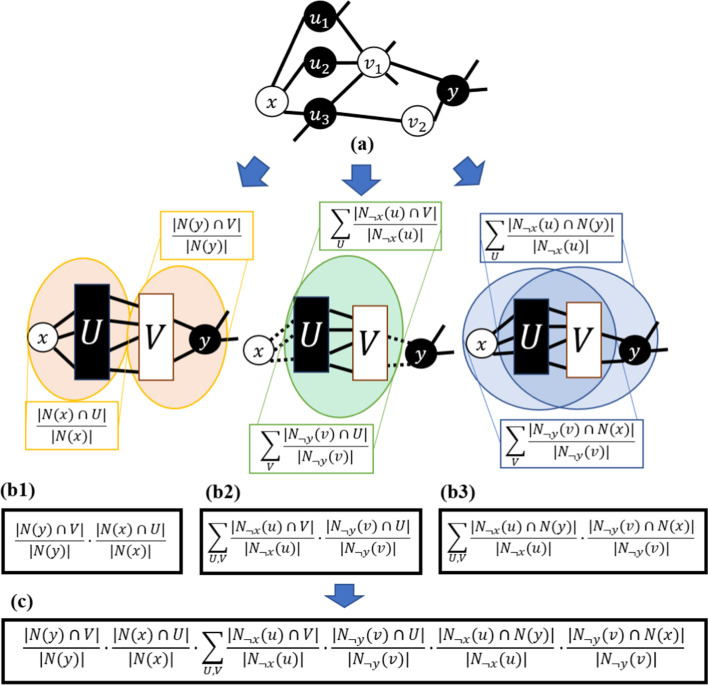
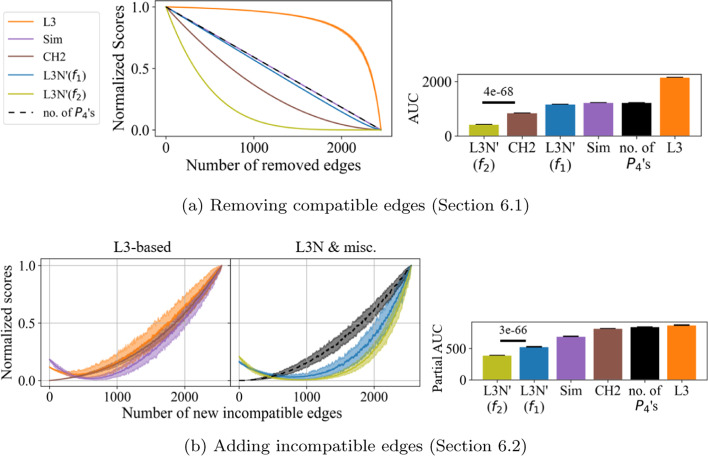
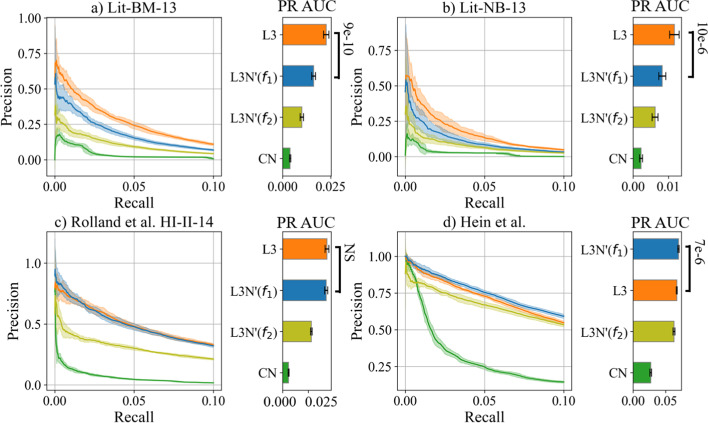
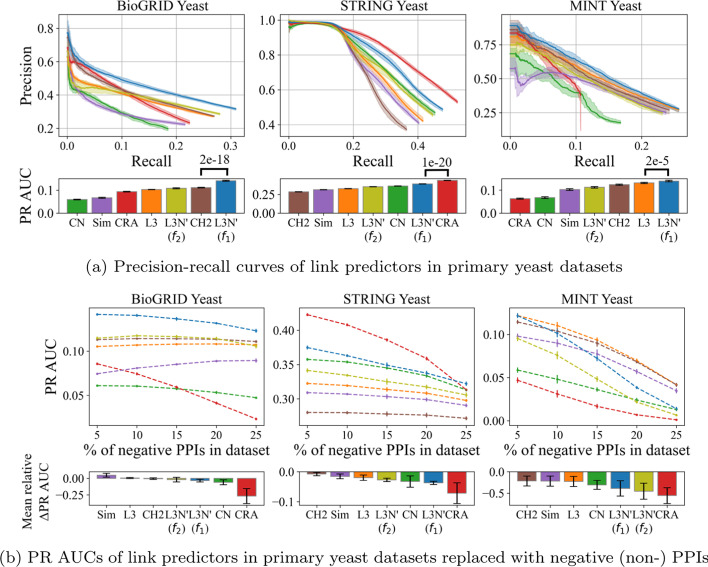
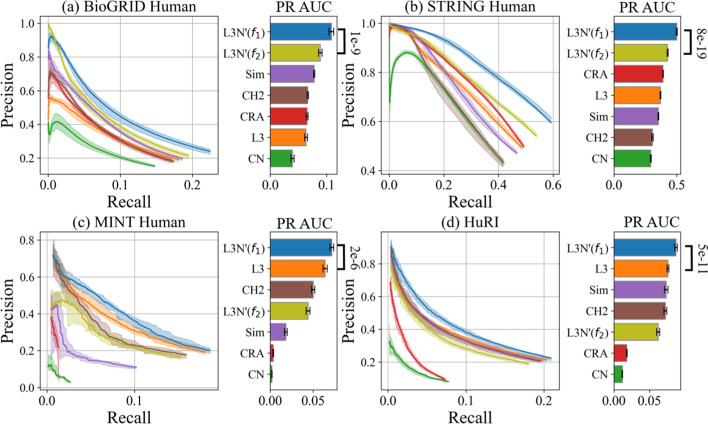
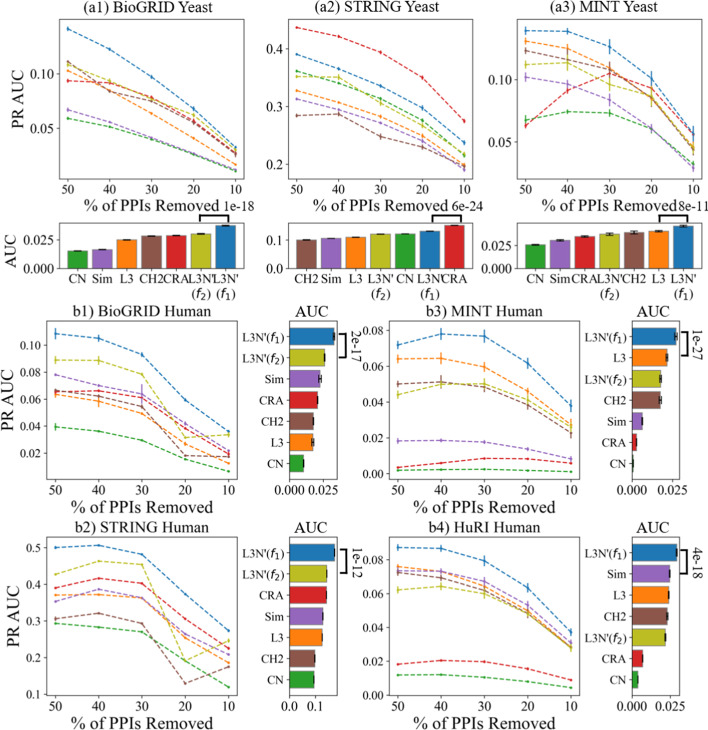
Results: In this article, we propose a formulation of link predictors that we call NormalizedL3 (L3N) which addresses certain missing elements within L3 predictors in the perspective of network modeling. Our computational validations show that the L3N predictors are able to find missing PPIs more accurately (in terms of true positives among the predicted PPIs) than the previously proposed methods on several datasets from the literature, including BioGRID, STRING, MINT, and HuRI, at the cost of using more computation time in some of the cases. In addition, we found that L3-based link predictors (including L3N) ranked a different pool of PPIs higher than the general-purpose link predictors did. This suggests that different types of PPIs can be predicted based on different topological assumptions, and that even better PPI link predictors may be obtained in the future by improved network modeling.
Keywords: Complex Network; Graph Theory; L3 Principle; Link Prediction; Network Modeling; Protein–Protein Interaction.
© 2023. The Author(s).
Conflict of interest statement
The authors declare no competing interests.
Figures
Similar articles
-
Reconstructing genome-wide protein-protein interaction networks using multiple strategies with homologous mapping.PLoS One. 2015 Jan 20;10(1):e0116347. doi: 10.1371/journal.pone.0116347. eCollection 2015. PLoS One. 2015. PMID: 25602759 Free PMC article.
-
The Intrinsic Geometric Structure of Protein-Protein Interaction Networks for Protein Interaction Prediction.IEEE/ACM Trans Comput Biol Bioinform. 2016 Jan-Feb;13(1):76-85. doi: 10.1109/TCBB.2015.2456876. IEEE/ACM Trans Comput Biol Bioinform. 2016. PMID: 26886733
-
Comparative analysis and assessment of M. tuberculosis H37Rv protein-protein interaction datasets.BMC Genomics. 2011 Nov 30;12 Suppl 3(Suppl 3):S20. doi: 10.1186/1471-2164-12-S3-S20. Epub 2011 Nov 30. BMC Genomics. 2011. PMID: 22369691 Free PMC article.
-
Protein-protein interaction networks as miners of biological discovery.Proteomics. 2022 Aug;22(15-16):e2100190. doi: 10.1002/pmic.202100190. Epub 2022 May 24. Proteomics. 2022. PMID: 35567424 Review.
-
Introducing dysfunctional Protein-Protein Interactome (dfPPI) - A platform for systems-level protein-protein interaction (PPI) dysfunction investigation in disease.Curr Opin Struct Biol. 2024 Oct;88:102886. doi: 10.1016/j.sbi.2024.102886. Epub 2024 Jul 13. Curr Opin Struct Biol. 2024. PMID: 39003916 Review.
Cited by
-
Ensemble decision of local similarity indices on the biological network for disease related gene prediction.PeerJ. 2024 Sep 5;12:e17975. doi: 10.7717/peerj.17975. eCollection 2024. PeerJ. 2024. PMID: 39247551 Free PMC article.
-
Link Prediction with Continuous-Time Classical and Quantum Walks.Entropy (Basel). 2023 Apr 28;25(5):730. doi: 10.3390/e25050730. Entropy (Basel). 2023. PMID: 37238485 Free PMC article.
References
-
- Cusick ME, Klitgord N, Vidal M, Hill DE. Interactome: gateway into systems biology. Human Mol Genet. 2005;14(suppl_2):171–81. 10.1093/hmg/ddi335. - PubMed
MeSH terms
LinkOut - more resources
Full Text Sources
Miscellaneous
