. 2023 Feb 21;14(1):670.
doi: 10.1038/s41467-023-36284-8.

Postnatal oogenesis leads to an exceptionally large ovarian reserve in naked mole-rats

Affiliations

Postnatal oogenesis leads to an exceptionally large ovarian reserve in naked mole-rats

Miguel Angel Brieño-Enríquez et al. Nat Commun. .

Abstract

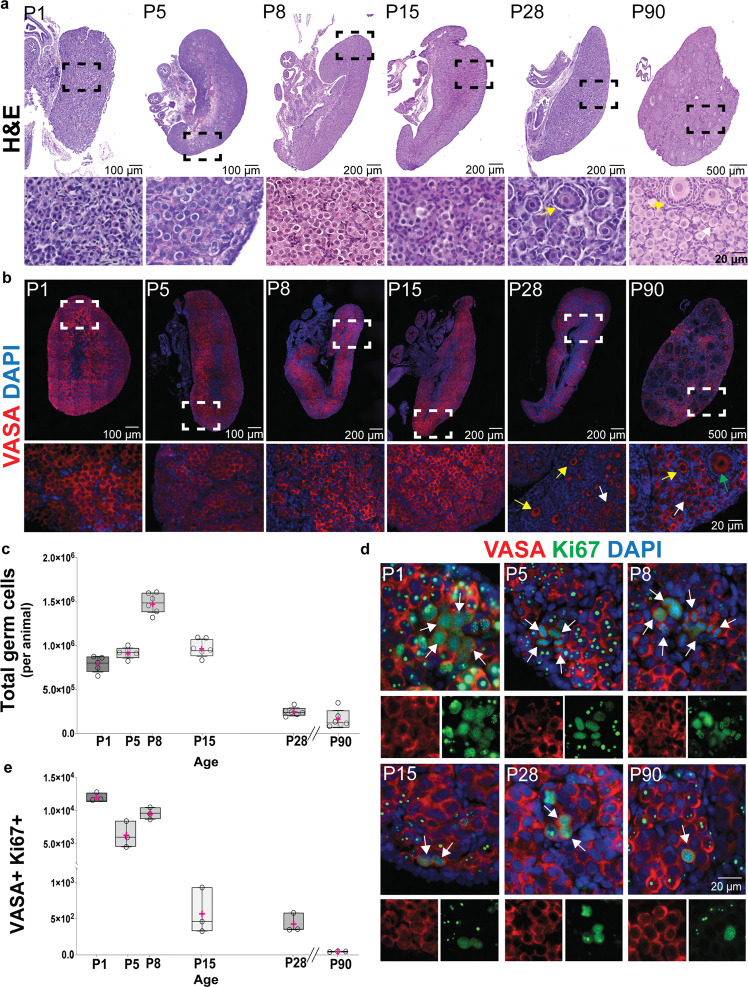
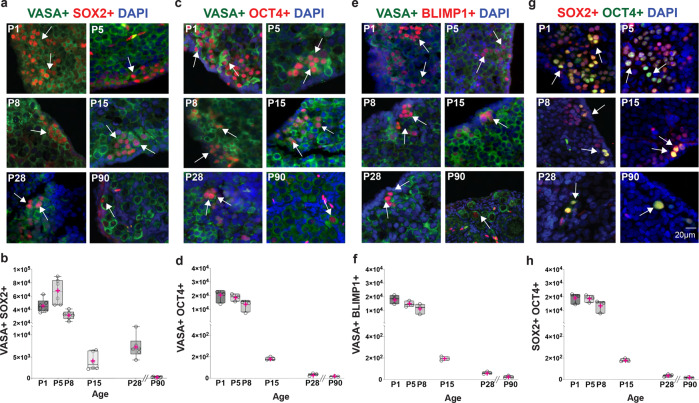
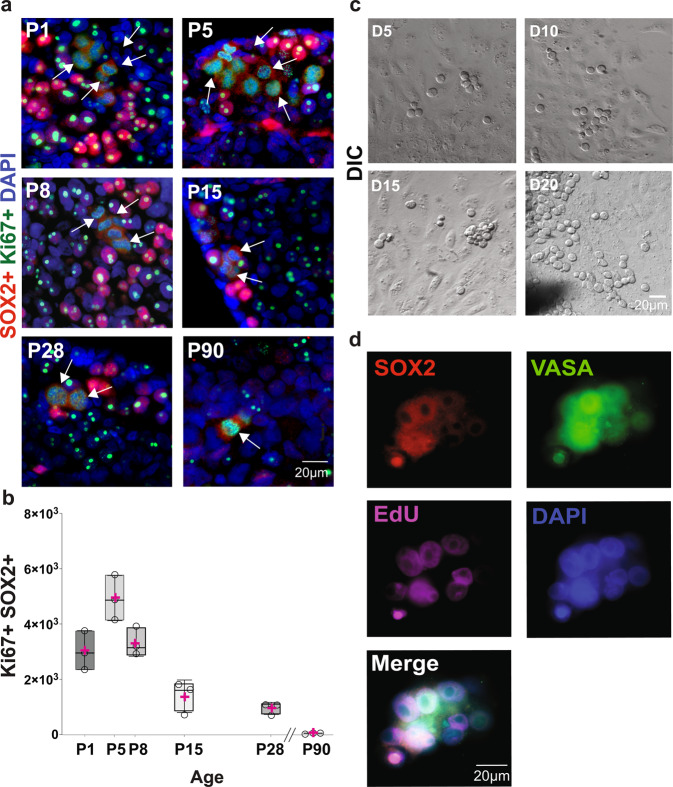
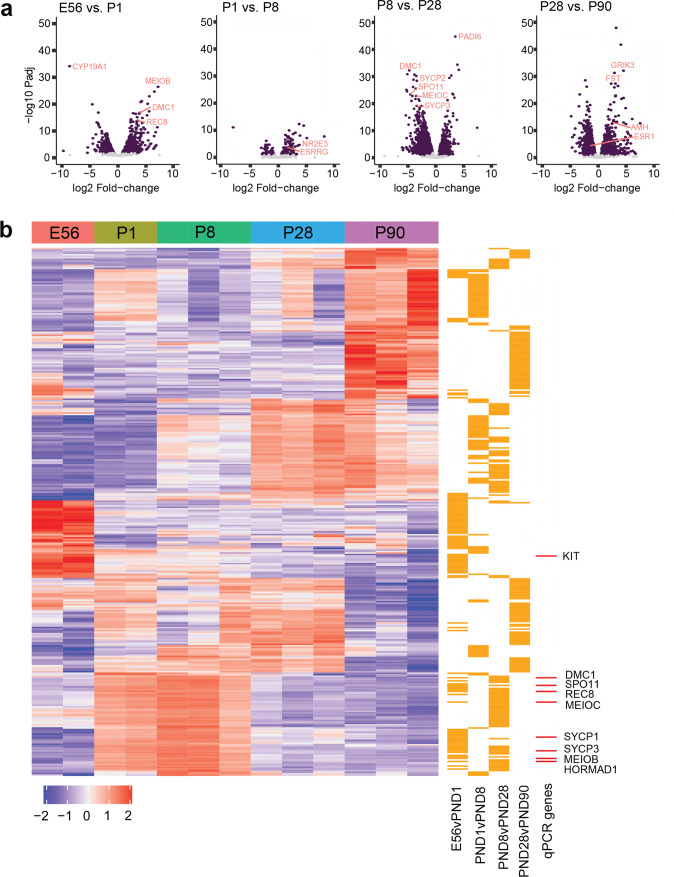
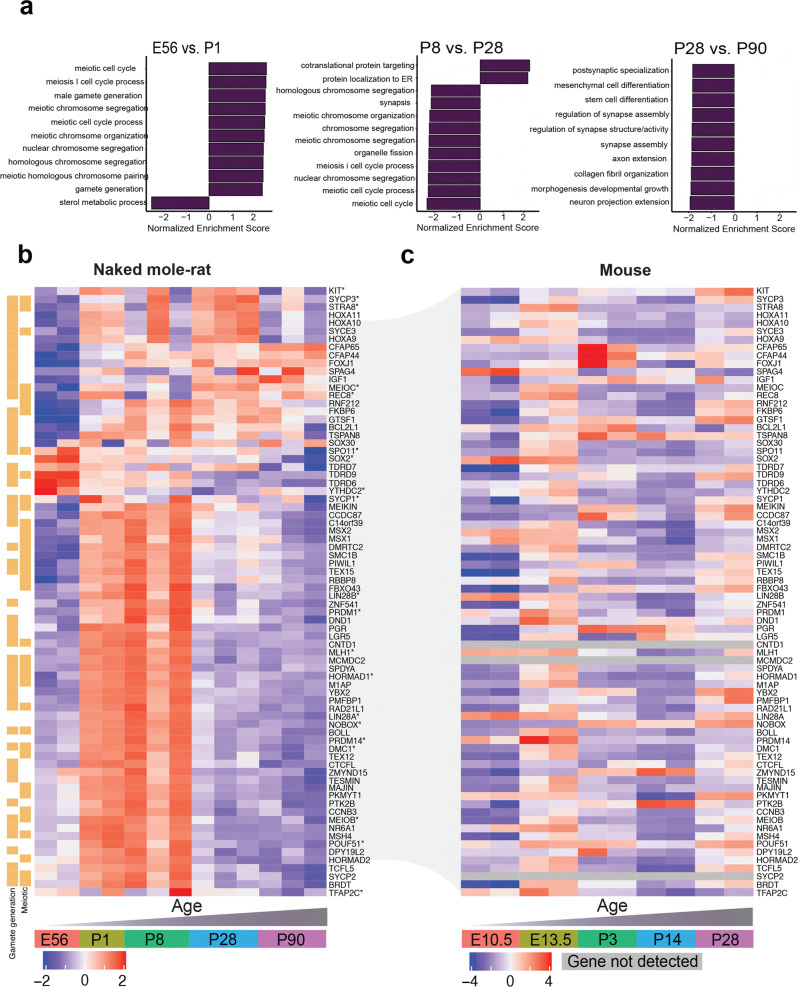
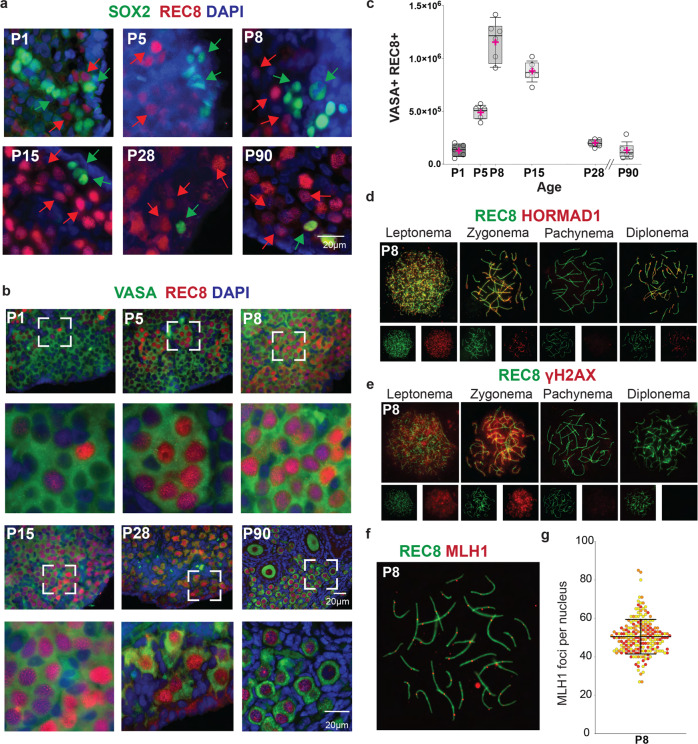
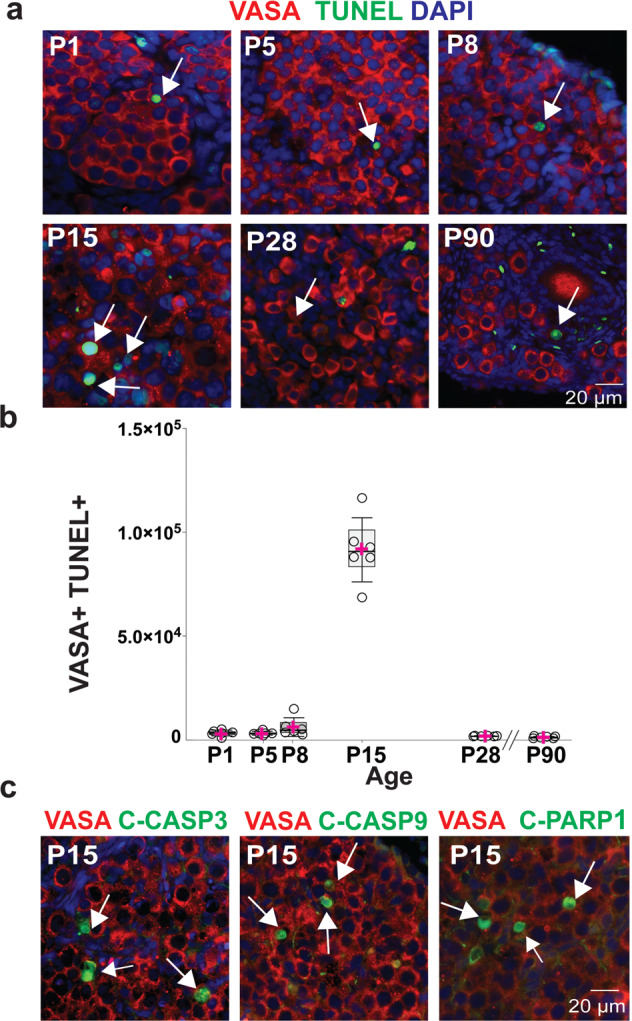
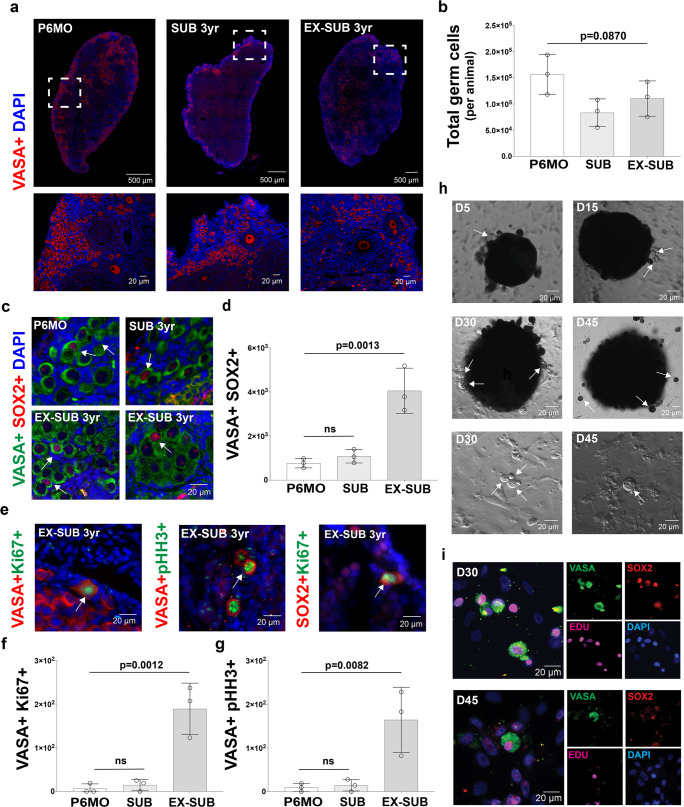
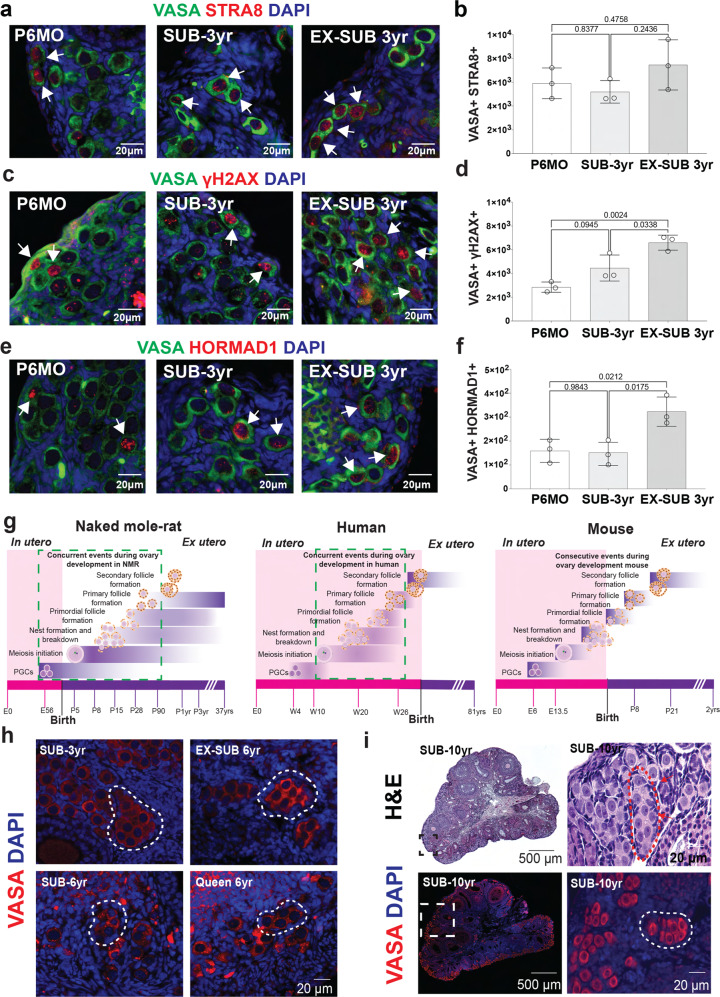
In the long-lived naked mole-rat (NMR), the entire process of oogenesis occurs postnatally. Germ cell numbers increase significantly in NMRs between postnatal days 5 (P5) and P8, and germs cells positive for proliferation markers (Ki-67, pHH3) are present at least until P90. Using pluripotency markers (SOX2 and OCT4) and the primordial germ cell (PGC) marker BLIMP1, we show that PGCs persist up to P90 alongside germ cells in all stages of female differentiation and undergo mitosis both in vivo and in vitro. We identified VASA+ SOX2+ cells at 6 months and at 3-years in subordinate and reproductively activated females. Reproductive activation was associated with proliferation of VASA+ SOX2+ cells. Collectively, our results suggest that highly desynchronized germ cell development and the maintenance of a small population of PGCs that can expand upon reproductive activation are unique strategies that could help to maintain the NMR's ovarian reserve for its 30-year reproductive lifespan.


Conflict of interest statement

The authors declare no competing interests.

Figures

Fig. 1
Fig. 1. Postnatal ovaries from naked mole-rats (NMR) have a large ovarian reserve with actively dividing germ cells.
a Histological sections of NMR ovaries at different stages of development (postnatal day P1, P5, P8, P15, P28, and P90) stained with hematoxylin and eosin. b Histological sections stained with antibody against VASA (DDX4; red) and counterstained with DAPI (blue) to reveal DNA. White arrows indicate an example of primordial follicles, yellow arrows indicate an example of primary follicles, and green arrow indicates a secondary follicle. c Quantification of the total germ cell numbers per NMR detected with VASA at P1, P5, P8, P15, P28, and P90 (n = 6 per group). In all the graphs the box edges represent 25th and 75th percentiles, the horizontal line inside the box represents the median, and the pink ‘+‘ represents the mean. In one-way-ANOVA, adjusting for multiple comparisons using the Bonferroni method, all pairwise comparisons were statistically significant at p < 0.0001, except for the comparisons P1 vs P5 (p = 0.35), P5 vs P15 (p > 0.99) and P28 vs P90 (p > 0.99). d In vivo postnatal germ cell expansion analyzed using immunofluorescence detection of the marker of mitotic cell division Ki67 (green) and the germ cell marker VASA (red). White arrows indicate cells that are positive for both markers. e Quantification of the mitotically active germ cells across the different ages using Ki67 and VASA as markers at P1, P5, P8, P15, P28, and P90 (n = 3 per group). For box plots of VASA+ Ki67+, all pairwise comparisons were statistically significant at p < 0.0001, except for age P1 vs P8 (p = 0.11), P15 vs P28, P15 vs P90, and P28 vs P90 (all p > 0.99). Source data are provided as a Source Data File.
Fig. 2
Fig. 2. Presence of pluripotency and primordial germ cell markers in postnatal naked mole-rat (NMR) ovaries.
a NMR ovary sections stained with the pluripotency marker SOX2 (red), VASA (green), and DAPI (blue). White arrows indicate representative SOX2 positive cells. b Quantification of SOX2 positive cells at P1, P5, P8, P15, P28, and P90 (n = 6 per group). In all the graphs, the box edges represent 25th and 75th percentiles, the horizontal line inside the box represents the median, and the pink ‘+‘ represents the mean. In one-way-ANOVA, adjusting for multiple comparisons using the Bonferroni method, all pairwise comparisons were statistically significant at p < 0.0001, except for P1 vs P8 (p = 0.18), P15 vs P28, P28 vs P90, and P15 vs P90 (all p > 0.99). c NMR ovary sections stained with the pluripotency marker OCT4 (red), VASA (green), and DAPI (blue). White arrows indicate representative SOX2-positive cells. d Quantification of VASA+ OCT4+ positive cells at P1, P5, P8, P15, P28, and P90 (n = 3 per group), and all pairwise comparisons were statistically significant at p < 0.0001, except for P5 vs P8 (p = 0.10), P1 vs. P8, P15 vs. P28, P15 vs. P90, and P28 vs P90 (all p > 0.99). e Detection of the PGC marker BLIMP1+ (red) and VASA (green) on the NMR ovary. f Quantification of VASA+ BLIMP1+ cells at P1, P5, P8, P15, P28, and P90 (n = 3 per group), and all pairwise comparisons were statistically significant at p < 0.0001, except for P1 vs. P5, P5 vs. P8, P15 vs. P28, P15 vs. P90 and P28 vs. P90 (all p > 0.99). g Co-staining of the pluripotency markers SOX2+ (red) and OCT4+ (green) on the NMR ovary. h Quantification of SOX2+ OCT4+ cells at P1, P5, P8, P15, P28, and P90 (n = 3 per group), and all pairwise comparisons were statistically significant at p < 0.0001, except for P1 vs. P5, P1 vs. P8, P5 vs. P8, and for those among ages P15, P28, and P90 (all p > 0.99).
Fig. 3
Fig. 3. In vivo and in vitro postnatal mitotic germ cell expansion in the NMR ovaries.
a In vivo postnatal SOX2+ cell expansion analyzed using immunofluorescence detection of the marker of mitotic cell division Ki67 (green) and SOX2 (red). White arrows indicate cells that are positive for both markers. b Quantification of SOX2+ Ki67+ cells at different ages (P1, P5, P8, P15, P28, and P90; n = 3 per group), and all pairwise comparisons were statistically significant at p < 0.0001, except for P5 vs P8 (p = 0.07), P1 vs P15 (p = 0.05), P15 vs P90 (p = 0.20), P28 vs P90 (p = 0.83), P1 vs P8 and P15 vs P28 (both p > 0.99). c In vitro expansion of germ cell from the P5 NMR ovary at day D5, D10, D15, and D20 in culture (DIC). d Immunodetection of the pluripotency marker SOX2 (red), germ cell marker VASA (green), incorporation of ethynyl-labeled deoxyuridine (EdU) (magenta) and DAPI (blue) in cultured cells from P5 NMR ovary at D10. Source data are provided as a Source Data File.
Fig. 4
Fig. 4. RNAseq analysis of ovaries at E56, P1, P8, P28, and P90.
a Volcano plot with genes that are significantly different coloured in purple (adjusted p value <0.05 and log2 fold-change > abs(log2(1.5)). b A heatmap of the top 50 upregulated and top 50 downregulated differentially-expressed genes from each sequential pairwise comparison (counts per million). Gene expression is scaled and clustered by unsupervised hierarchical clustering. The orange bars to the right of the heatmap mark from which comparison the gene originates. The red bars to the right of the heatmap in b mark which of the DEGs were also profiled in the qPCR experiment. Source data are provided as a Source Data File.
Fig. 5
Fig. 5. Comparing transcriptomic profiles of ovarian development in naked mole-rats and mice.
a GSEA was performed for the ranked gene list (−1 * log2 fold-change * adjusted p value) of each sequential pairwise comparison using the c5 biological processes gene set. Bar plots of the normalized enrichment score show up to 10 positively- and 10 negatively-enriched pathways per comparison (ranked by normalized enrichment score; threshold: adjusted p value <0.05). b A heatmap of gene expression (counts per million) from the RNAseq data in the naked mole-rat ovary. The gene list includes the intersection of genes quantified by qPCR (labeled with asterisk) and genes that enriched for meiotic pathways from the E56 vs. PND1 gene list. Gene expression is scaled, and genes clustered by unsupervised hierarchical clustering. c A heatmap of the gene expression (counts per million) in the mouse ovary. Source data are provided as a Source Data File.
Fig. 6
Fig. 6. Postnatal meiosis in the naked mole-rat (NMR) ovary.
a NMR ovary at P1, P5, P8, P15, P28, and P90, showing co-existence of cells positive for the pluripotency marker SOX2 (green) and the meiosis-specific cohesin REC8 (red). DAPI is shown in blue. Green arrows indicate representative SOX2 positive cells and red arrows indicate representative REC8 positive cells. b Immunofluorescence for germ cell marker VASA (green), meiotic cohesin REC8 (red), and DAPI (blue), showing cells in meiotic prophase I on tissue sections of NMR ovaries. c Quantification of REC8/VASA positive cells on ovaries from NMR (P1 (n = 5), P5, P8, P15, P28, and P90 (n = 6 each group)). In all the graphs, the box edges represent 25th and 75th percentiles, the horizontal line inside the box represents the median, and the pink ‘+‘ represents the mean. One-way-ANOVA, adjusting for multiple comparisons using the Bonferroni method, all pairwise comparisons were statistically significant at p < 0.0001, except for age P5 vs P28 (p = 0.16), P5 vs P90 (p = 0.06), P8 vs P15, P28 vs P90, and P28 vs P1 (p > 0.99 for all). d Indirect analysis of synapsis performed by the presence of REC8 (green) and HORMAD1 (red). Presence of HORMAD1 protein indicates places where the homologous chromosomes are asynapsed. e Double strand break formation identified by the presence of the meiotic cohesin REC8 (green) and the marker of DNA damage γH2AX (red) and from leptonema to diplonema. f Immunolocalization of REC8 (green) and MLH1 (red) on chromosome spreads from oocytes at P8. g Quantification of MLH1 foci numbers per nucleus from P8 (n = 300). Each color on the graph refers to the counts from a single animal. Source data are provided as a Source Data File.
Fig. 7
Fig. 7. Postnatal germ cell loss in the NMR ovary.
a Naked mole-rat ovaries at P1, P5, P8, P15, P28 and P90, showing the presence of apoptotic germ cells (VASA, red) using TUNEL (green). b Quantification of VASA/TUNEL cells at different stages of development (P1, P5, P8, P15, P28, P90; n = 6 per group). Box plot of TUNEL by age, the box edges represent 25th and 75th percentiles, the horizontal line inside the box represents the median, and the pink ‘+‘ represents the mean. One-way-ANOVA, adjusting for multiple comparison using Bonferroni method, only pairwise comparisons that were statistically significant at p < 0.0001 were between age 15 an all-other age. c P15 ovaries stained with VASA (red), DAPI (blue) and markers of apoptosis (red): TUNEL, cleaved-caspase-3 (C-CASP3), cleaved-caspase-9 (C-CAS9) and cleaved-poly (ADP-ribose) polymerase-1 (PARP1) (C-PARP1). White arrows indicate representative apoptotic cells. Source data are provided as a Source Data File.
Fig. 8
Fig. 8. Six-month-old, subordinate adult, and ex-subordinate adult ovaries from naked mole-rats (NMR) have a large ovarian reserve with actively dividing germ cells.
a Histological sections of 6-month-old (P6MO), 3 yr old subordinate (SUB-3yr; reproductively suppressed), and 3 yr old ex-subordinate (EX-SUB 3 yr; reproductively activated) ovaries stained with antibody against VASA (red) and counterstained with DAPI (blue). b Quantification of the total germ cell number per NMR detected with VASA at P6MO, SUB-3yr, and EX-SUB 3 yr (n = 3 per group). One-way ANOVA shows no statistically significant difference between groups; p = 0.870. c NMR ovary sections stained with VASA (green), the pluripotency marker SOX2 (red), and DAPI (blue). White arrows indicate representative SOX2-positive cells. d Quantification of SOX2 positive cells at P6MO, SUB-3yr and EX-SUB 3 yr (n = 3 per group). One-way ANOVA, adjusting for multiple comparisons using the Bonferroni method, reveals pairwise comparisons with EX-SUB were statistically significant at p < 0.0013. No differences were observed between P6MO and SUB-3yr (p = 0.7792). e In vivo postnatal cell expansion in adult NMR ovaries analyzed using immunofluorescence detection of VASA (red), and marker of mitotic cell division Ki67 (green); VASA (red) and the pHH3 (green), and SOX2 (red) and Ki67 (green). White arrows indicate cells that are positive for both markers. f Quantification of VASA+ Ki67+ cells at P6MO, SUB-3yr and EX-SUB 3 yr (n = 3 per group). One-way ANOVA, adjusting for multiple comparisons using the Bonferroni method, pairwise comparisons with EX-SUB were statistically significant at p < 0.0012. No differences were observed between P6MO and SUB- 3 yr (p = 0.0775). g Quantification of VASA+ pHH3+ cells at P6MO, SUB-3yr and EX-SUB 3 yr (n = 3 per group). One-way ANOVA, adjusting for multiple comparisons using the Bonferroni method, pairwise comparisons with EX-SUB were statistically significant at p < 0.0082. No differences were observed between P6MO and SUB-3yr (p = 0.9895). h In vitro expansion of germ cells from EX-SUB 3 yr old ovary at day D5, D15, D30, and D45 of culture. White arrows show germ cells. i Immunodetection of VASA (green), the pluripotency marker SOX2 (red), incorporation of ethynyl-labeled-deoxyuridine (EdU) (magenta), and DAPI (blue) in cultured cells from EX-SUB 3 yr old ovary. Source data are provided as a Source Data File.
Fig. 9
Fig. 9. Initiation of meiotic prophase I in adult NMRs, models of ovary development in NMR, human, and mouse, and persistence of germ cell nests in NMR adult ovaries.
a Histological sections of P6MO, SUB-3yr, and EX-SUB 3 yr ovaries stained with antibody against VASA (green), STRA8 (red) and counterstained with DAPI (blue). b Quantification of the total germ cell number per NMR detected with VASA+ STRA8+ at P6MO, SUB-3yr, and EX-SUB 3 yr (n = 3 per group). One-way ANOVA shows no statistically significant. c NMR ovarian sections stained with VASA (green), γH2AX (red), and DAPI (blue). d Quantification of VASA+ γH2AX+ positive cells at P6MO, SUB-3yr and EX-SUB 3 yr (n = 3). One-way ANOVA, adjusting for multiple comparisons using the Bonferroni method, reveals pairwise comparisons with EX-SUB 3 yr were statistically significant at p < 0.0024. No differences were observed between P6MO and SUB-3yr. e NMR ovarian sections stained with VASA (green), HORMAD1 (red), and DAPI (blue). f Quantification of VASA+ HORMAD1+ cells at P6MO, SUB-3yr and EX-SUB 3 yr (n = 3). One-way ANOVA, adjusting for multiple comparisons using the Bonferroni method, pairwise comparisons with EX-SUB 3 yr were statistically significant at p < 0.0212. No differences were observed between P6MO and SUB-3yr. White arrows indicate representative positive cells. g Model of NMR ovary development from E56 to adulthood. Model of human ovary development from embryonic week 4 to adulthood. Green boxes represent processes that occur simultaneously. Model of mouse ovary development, showing the consecutive events during ovary development. Pink bar at the bottom indicates processes that occur in utero and purple bar those that occur after birth. h Immunofluorescence with VASA (red) and DAPI (blue) showing germ cell nests (white dashed lines) in ovaries from SUB-3yr-old, EX-SUB-3yr-old, SUB-6yr-old and breeding queen 6yr-old. i Upper images: Hematoxylin-eosin staining of 10-year-old NMR ovary showing persistence of germ cell nests. Red arrows point to a germ cell nest. Lower images: Immunofluorescence with VASA (red) and DAPI (blue) showing a large population of germ cells. White dashed square within the left image shown at a higher magnification on the right, white dashed line shows a germ cell nest. Source data are provided as a Source Data File.

Similar articles

Cited by

References

    1. Grive KJ, Freiman RN. The developmental origins of the mammalian ovarian reserve. Development. 2015;142:2554–2563. doi: 10.1242/dev.125211. - DOI - PMC - PubMed
    1. Hertig AT, Adams EC. Studies on the human oocyte and its follicle. I. Ultrastructural and histochemical observations on the primordial follicle stage. J. Cell Biol. 1967;34:647–675. doi: 10.1083/jcb.34.2.647. - DOI - PMC - PubMed
    1. Ge W, Li L, Dyce PW, De Felici M, Shen W. Establishment and depletion of the ovarian reserve: physiology and impact of environmental chemicals. Cell Mol. Life Sci. 2019;76:1729–1746. doi: 10.1007/s00018-019-03028-1. - DOI - PMC - PubMed
    1. Fuyuta M, Miyayama Y, Fujimoto T. Histochemical identification of primordial germ cells in human embryos by PAS reaction. Okajimas Folia Anat. Jpn. 1974;51:251–262. doi: 10.2535/ofaj1936.51.5_251. - DOI - PubMed
    1. Fujimoto T, Miyayama Y, Fuyuta M. The origin, migration and fine morphology of human primordial germ cells. Anat. Rec. 1977;188:315–330. doi: 10.1002/ar.1091880305. - DOI - PubMed

Publication types