. 2023 Apr 3;133(7):e162685.
doi: 10.1172/JCI162685.

Pathogenic human variant that dislocates GATA2 zinc fingers disrupts hematopoietic gene expression and signaling networks

Affiliations

Pathogenic human variant that dislocates GATA2 zinc fingers disrupts hematopoietic gene expression and signaling networks

Mabel Minji Jung et al. J Clin Invest. .

Abstract

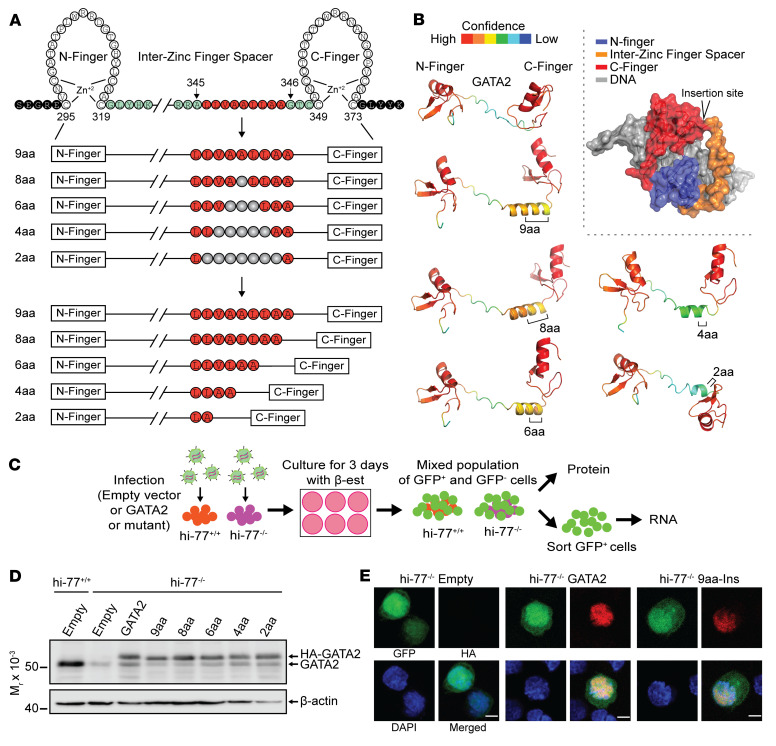
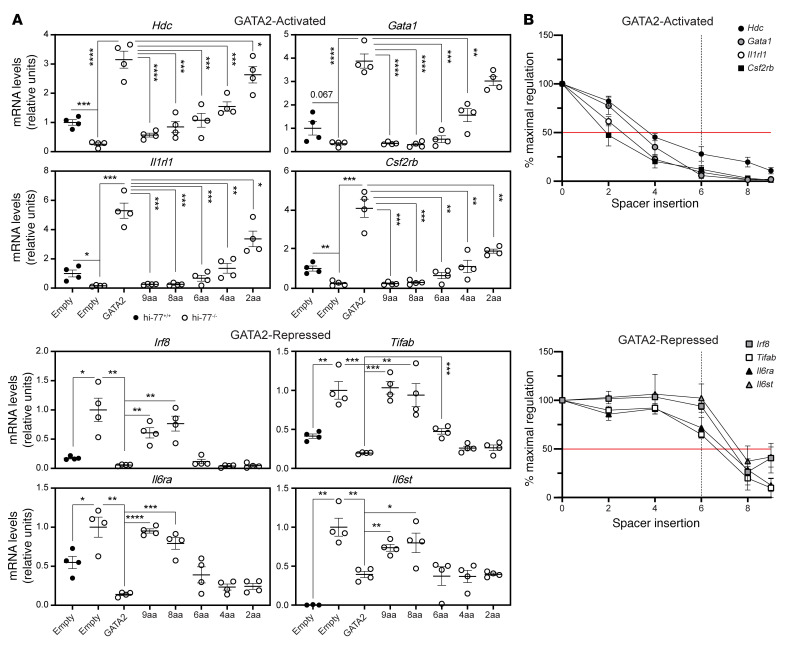
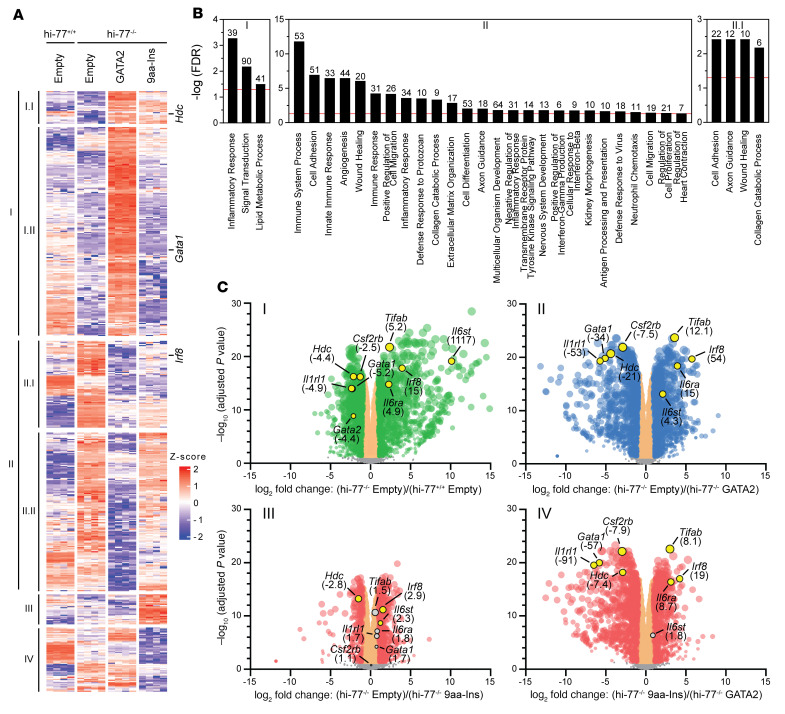
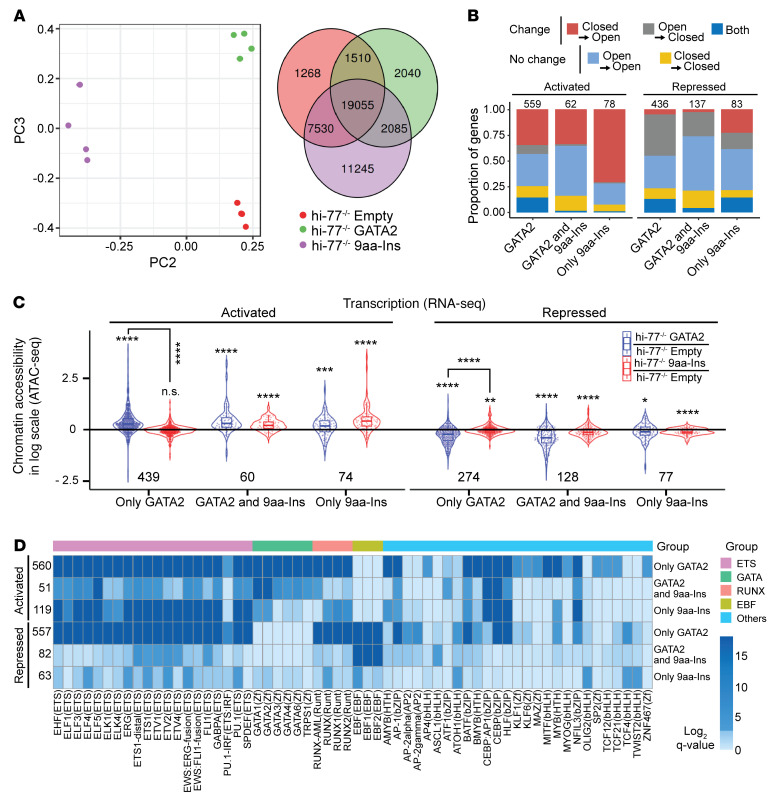
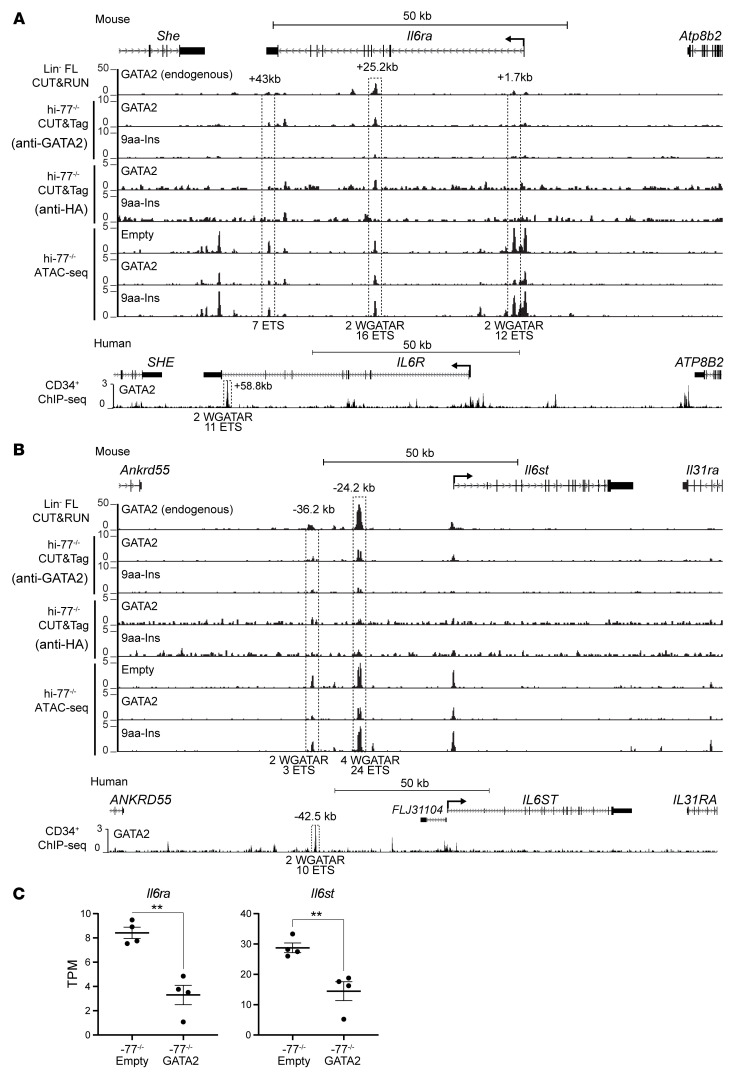
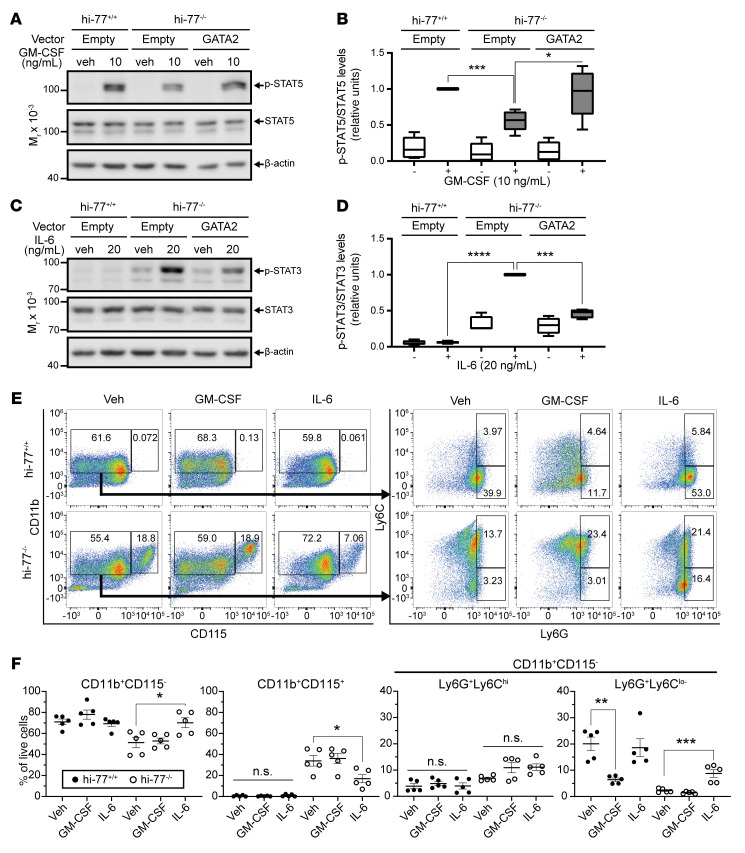
Although certain human genetic variants are conspicuously loss of function, decoding the impact of many variants is challenging. Previously, we described a patient with leukemia predisposition syndrome (GATA2 deficiency) with a germline GATA2 variant that inserts 9 amino acids between the 2 zinc fingers (9aa-Ins). Here, we conducted mechanistic analyses using genomic technologies and a genetic rescue system with Gata2 enhancer-mutant hematopoietic progenitor cells to compare how GATA2 and 9aa-Ins function genome-wide. Despite nuclear localization, 9aa-Ins was severely defective in occupying and remodeling chromatin and regulating transcription. Variation of the inter-zinc finger spacer length revealed that insertions were more deleterious to activation than repression. GATA2 deficiency generated a lineage-diverting gene expression program and a hematopoiesis-disrupting signaling network in progenitors with reduced granulocyte-macrophage colony-stimulating factor (GM-CSF) and elevated IL-6 signaling. As insufficient GM-CSF signaling caused pulmonary alveolar proteinosis and excessive IL-6 signaling promoted bone marrow failure and GATA2 deficiency patient phenotypes, these results provide insight into mechanisms underlying GATA2-linked pathologies.

Keywords: Genetic variation; Genetics; Hematology; Signal transduction; Transcription.


Conflict of interest statement

Conflict of interest: The authors have declared that no conflict of interest exists.

Figures

Figure 1
Figure 1. Artificial GATA2 transcription factors with variable inter–zinc finger spacers.
(A) Mouse GATA2 9aa, 8aa, 6aa, 4aa, and 2aa insertion variants. The 9aa-Ins spacer variant models a human disease mutation (36). (B) AlphaFold prediction of structures. Model of GATA2 insertion site relative to the C-finger and N-finger. (C) Rescue assay with HoxB8-immortalized Gata2 hi–77+/+ and mutant (hi–77–/–) cells. β-est, β-estradiol. (D) Western blot with anti-GATA2 antibody of hi–77 cells expressing endogenous GATA2 with or without HA-tagged GATA2 or variants (n = 9). (E) Immunofluorescence analysis of HA-GATA2 localization in hi–77 cells. Scale bars: 5 μm.
Figure 2
Figure 2. GATA2 9aa-Ins disease variant is severely defective, but not entirely inactive, in genome regulation.
(A) Model 1, 9aa-Ins fails to regulate all GATA2-regulated genes; model 2, 9aa-Ins fails to repress GATA2-regulated genes; model 3, 9aa-Ins fails to activate GATA2-regulated genes; model 4, 9aa-Ins ectopically regulates genes that are not regulated by GATA2. (B) Overlap of DEGs that are –77-, GATA2-, and 9aa-Ins–regulated. RNA-Seq (4 biological replicates) of hi–77+/+ with control vector (hi–77+/+ empty), hi–77–/– with control vector (hi–77–/– empty), hi–77–/– with GATA2 (hi–77–/– GATA2), and hi–77–/– with 9aa-Ins (hi–77–/– 9aa-Ins). DEGs in hi–77+/+ empty, hi–77–/– GATA2, and hi–77–/– 9aa-Ins were defined as |log2(fold change)| ≥ 1 and adjusted P value < 0.05 relative to hi–77–/– empty. Each circle represents DEGs in the 3 categories: green circle, enhancer-regulated, (hi–77–/– empty)/(hi–77+/+ empty); blue circle, GATA2-regulated, (hi–77–/– empty)/(hi–77–/– GATA2); pink circle, 9aa-Ins–regulated, (hi–77–/– empty)/(hi–77–/– 9aa-Ins). DEGs were parsed into activated or repressed. DEG numbers are shown in parentheses. (C) Correlation plots depicting retention of 9aa-Ins–mediated activation and repression relative to GATA2. Comparison was calculated using |log2(fold change)| ≥ 1 of (hi–77–/– empty)/(hi–77–/– GATA2) and (hi–77–/– empty)/(hi–77–/– 9aa-Ins). Genes were required to have TPM ≥1 in all replicates in hi–77–/– GATA2 for activation and hi–77–/– empty for repression. (D) PCA quantifying multidimensional scaling distances between transcriptomes (4 biological replicates). (E) Percentage of 9aa-Ins–regulated genes that are not GATA2-regulated analyzed by subtraction of overlap of (hi–77–/– empty)/(hi–77–/– GATA2) from (hi–77–/– empty)/(hi–77–/– 9aa-Ins). P cutoffs ranged from 0.01 to 0.1. (F) Percentage of GATA2-regulated genes that are not 9aa-Ins–regulated analyzed by subtraction of (hi–77–/– empty)/(hi–77–/– 9aa-Ins) from (hi–77–/– empty)/(hi–77–/– GATA2). The same 10 P cutoffs as in E were used. The percentages of DEGs for each cutoff were parsed into activated or repressed. Statistical calculations used Mann-Whitney U test; ****P < 0.0001.
Figure 3
Figure 3. Inter–zinc finger spacer constraints for GATA2-mediated activation versus repression.
(A) qRT-PCR analysis of mRNA expression in hi–77–/– cells rescued with GATA2 or variants (n = 4). (B) Comparison of the percentage maximal activation and repression calculated with data from A. 100% or 0% activation and repression determined by analysis of hi–77–/– cells with or without HA-GATA2. Red line, 50% regulation. Dotted line, 6aa insertion that impaired activation, but not repression, by more than 50%. Error bars represent mean ± SEM. Statistical calculations used unpaired 2-tailed Student’s t test with Benjamini-Hochberg correction; *P < 0.05; **P < 0.01; ***P < 0.001; ****P < 0.0001.
Figure 4
Figure 4. Biological/mechanistic insights revealed from GATA2 disease variant transcriptomics.
(A) DEGs that are GATA2-regulated, GATA2- and 9aa-Ins–regulated, and 9aa-Ins–regulated from comparison of hi–77–/– empty (n = 4), hi–77–/– GATA2 (n = 4), and hi–77–/– 9aa-Ins (n = 4). Z score was calculated from each gene’s log10(FPKM+10–3) from all RNA-Seq replicates. GATA2 or 9aa-Ins expression in hi–77–/– cells parsed the DEGs into: I, GATA2-activated; I.I, GATA2- and 9aa-Ins–activated; I.II, only GATA2-activated; II, GATA2-repressed; II.I, GATA2- and 9aa-Ins–repressed; II.II, only GATA2-repressed; III, ectopically activated; IV, ectopically repressed. (B) Gene Ontology (GO) analysis on 1,061 GATA2-activated, 1,077 GATA2-repressed, and 381 GATA2- and 9aa-Ins–repressed genes. Bar graphs represent –log(FDR) with a red line at FDR < 0.05 to determine statistical significance. Significant GO terms are presented. The number of genes comprised by each term is shown above the graphs. (C) Plots I, II, and III, expression changes from –77, GATA2, and 9aa-Ins regulation. 2,084 enhancer-regulated, 2,138 GATA2-regulated, and 939 GATA2-regulated genes from B are color-coded in green, blue, and pink, respectively. Plot IV, magnitude of expression between GATA2 and 9aa-Ins. DEGs are depicted in pink. GATA2-activated and -repressed DEGs are highlighted. Fold change relative to hi–77–/– empty or hi–77–/– GATA2 is shown in parentheses.
Figure 5
Figure 5. Multiomic analysis with GATA2 disease variant reveals principles of GATA2 function through chromatin.
(A) PCA quantifying multidimensional scaling distances between differential chromatin accessibility (ATAC-Seq, GEO GSE201968) with n = 4 biological replicates of hi–77–/– empty, hi–77–/– GATA2, hi–77–/– 9aa-Ins. Venn diagram depicts overlap. (B) Chromatin transitions of genes activated or repressed by GATA2, both GATA2 and 9aa-Ins, or only 9aa-Ins. Number of genes comprised by each group is shown above the graphs. (C) GATA2 and 9aa-Ins impact on chromatin accessibility. hi–77–/– GATA2/hi–77–/– empty signal or hi–77–/– 9aa-Ins/hi–77–/– empty signal was determined at genes activated/repressed by only GATA2, GATA2 and 9aa-Ins, and only 9aa-Ins conditions by amalgamation of ATAC-Seq peaks linked to DEGs. Statistical calculations to measure chromatin accessibility (>0 or <0 for differential accessibility) used Wilcoxon’s rank sum test. Comparisons between 2 groups used Wilcoxon’s signed rank test. *P < 0.05; **P < 0.01; ***P < 0.001; ****P < 0.0001. (D) Motif enrichment analysis at differentially accessible loci activated or repressed by only GATA2, GATA2 and 9aa-Ins, or only 9aa-Ins. Number of peaks comprised by each group is on the left of the heatmap. Peaks less than 100 kb from the start site were analyzed.
Figure 6
Figure 6. GATA2 occupancy and GATA2-regulated chromatin remodeling at GATA2-activated and -repressed loci.
GATA2 CUT&RUN with fetal liver Lin erythroid progenitors (Lin FL) and HA CUT&Tag with hi–77–/– GATA2 and hi–77–/– 9aa-Ins revealed GATA2 occupancy at GATA2-activated but not -repressed loci corresponding to ATAC-Seq profiles of GATA2-activated and GATA2-repressed genes. Peaks near the genes are boxed by dashed lines. WGATAR and ETS motifs located at peak sites are tabulated below.
Figure 7
Figure 7. GATA2 opposes a B-lineage gene expression program.
(A) Expression of GATA2-repressed CLP and B-lineage or myeloid genes in hi–77+/+ empty, hi–77–/– empty, hi–77–/– GATA2, and hi–77–/– 9aa-Ins from the RNA-Seq of Figure 2. Average TPM of hi–77–/– empty is presented as 100% of maximal expression. For multiple comparisons with hi–77–/– empty control, statistics were calculated using 1-way ANOVA followed by Dunnett’s test; *P < 0.05; ***P < 0.001; ****P < 0.0001. (B) mRNA levels of GATA2-repressed genes in hi–77+/+ cells infected with retrovirus to express EBF1 or empty vector (EV). Error bars represent mean ± SEM. Statistical calculations used unpaired 2-tailed Student’s t test. Welch’s correction was applied when variances were unequal (Ebf1, Igll1, Vpreb3, Pax5); *P < 0.05; ***P < 0.001; ****P < 0.0001. (C) Targeted ablation of a Spi1 (encoding PU.1) enhancer –14 kb upstream regulatory element (ΔURE) (77, 78). (D) GATA2-repressed target gene mRNA levels in hi–77–/– versus hi–77–/– cells lacking PU.1 enhancer. Error bars represent mean ± SEM. Statistical calculations used unpaired 2-tailed Student’s t test. Welch’s correction was applied when variances were unequal (Vpreb3); *P < 0.05; **P < 0.01; ***P < 0.001; ****P < 0.0001. (E) GATA2-mediated repression with GATA2 occupying and repressing Ebf1 expression and opposing PU.1-mediated activation. PU.1 induction of Ebf1 expression (75, 76, 123) is indicated by a dashed line.
Figure 8
Figure 8. GATA1 and GATA2 occupy and remodel Csf2rb chromatin.
(A) In mice, GATA2 CUT&RUN with Lin FL and GATA2 or HA CUT&Tag with hi–77–/– GATA2 and hi–77–/– 9aa-Ins revealed GATA2, but not 9aa-Ins, occupancy at the start site and 7 kb and 13 kb upstream of Csf2rb. ATAC-Seq revealed sites 7 kb and 13 kb upstream that were accessible only in hi–77–/– GATA2 cells. ChIP-Seq with human CD34+ cells (78) revealed GATA2 occupancy 8.8, 12.1, and 13.2 kb upstream of CSF2RB. GATA1 ChIP-Seq with CD34+ cells (79) and peripheral blood–derived erythroblast (PBDE) cells (79) revealed GATA1 occupancy 8.8 and 12.1 kb upstream. (B) GATA2 regulation of Csf2rb (RNA-Seq). GATA2-mediated activation of Csf2rb in primary Lin –77–/– progenitors with or without GATA2 (–77–/– empty vs. –77–/– GATA2) (61), WT or 9.5(Ets) motif–mutant bone marrow LSK cells with 5-FU [9.5+/+ 5-FU vs. 9.5(Ets)–/– 5-FU] (82), and G1E-ER-GATA1 erythroblasts with or without β-estradiol (G1E-ER-GATA1 vs. G1E-ER-GATA1 β-est) (68). To compare differences between 2 groups, statistical calculations used unpaired 2-tailed Student’s t test. For multiple comparisons, unpaired 1-way ANOVA was used, followed by Tukey’s test; **P < 0.01; ****P < 0.0001.
Figure 9
Figure 9. GATA2 occupies and remodels chromatin at Il6ra and Il6st.
(A) GATA2 CUT&RUN with murine Lin FL and GATA2 or HA CUT&Tag with hi–77–/– GATA2 and hi–77–/– 9aa-Ins revealed GATA2, but not 9aa-Ins, occupancy 25.2 kb downstream of Il6ra. ATAC-Seq revealed intronic (1.7 kb downstream) and 3′-UTR (43 kb downstream) sites less accessible in hi–77–/– GATA2 cells. ChIP-Seq with human CD34+ cells (78) revealed GATA2 occupancy 58.8 kb downstream of IL6R. (B) GATA2 ChIP-Seq with murine Lin fetal liver and GATA2 CUT&Tag with hi–77–/– GATA2 and hi–77–/– 9aa-Ins revealed GATA2, but not 9aa-Ins, occupancy 24.2 kb upstream of Il6st. ATAC-Seq with hi–77–/– empty, GATA2, and 9aa-Ins revealed intergenic sites (24.2 kb and 36.2 kb upstream) less accessible in hi–77–/– GATA2 cells. ChIP-Seq with human CD34+ cells (78) revealed occupancy 42.5 kb upstream of IL6ST. (C) GATA2-mediated repression of Il6ra and Il6st in primary Lin –77–/– hematopoietic progenitors with and without GATA2 (–77–/– empty vs. –77–/– GATA2) (55). Statistical calculations used unpaired 2-tailed Student’s t test; **P < 0.01.
Figure 10
Figure 10. GATA2-mediated regulation of cellular signaling and differentiation.
(A) Western blot to detect GM-CSF–induced STAT5 phosphorylation (n = 6). (B) p-STAT5 quantification. Results were normalized to GM-CSF–treated hi–77+/+ empty (box-and-whisker plots with bounds from the 25th to the 75th percentiles, the median line, and whiskers ranging from minimum to maximum values) (n = 6). (C) Western blot to detect IL-6–induced STAT3 phosphorylation (p-STAT3) (n = 4). (D) p-STAT3 quantification. Results were normalized to IL-6–treated hi–77–/– empty (box-and-whisker plots with bounds from the 25th to the 75th percentiles, the median line, and whiskers ranging from minimum to maximum values) (n = 4). Statistical comparisons in B and D used paired 2-tailed Student’s t tests with Benjamini-Hochberg correction; *P < 0.05; ***P < 0.001; ****P < 0.0001. (E) Flow cytometric plots of CD11b+CD115 (granulocytic) and CD11b+CD115+ (monocytic) differentiated progenitors cultured for 3 days in control, GM-CSF–containing, or IL-6–containing media (n = 5). Plots (gated at CD11b+CD115) of Ly6G+Ly6Chi and Ly6G+Ly6lo– differentiated progenitors cultured for 3 days in control, GM-CSF–containing, or IL-6–containing media (n = 5). (F) Quantification of CD11b+CD115, CD11b+CD115+, CD11b+CD115Ly6G+Ly6Ghi, and CD11b+CD115Ly6G+Ly6lo– populations. Error bars represent mean ± SEM. For multiple comparisons with vehicle-treated control, statistics were calculated using 1-way ANOVA followed by Dunnett’s test; *P < 0.05; **P < 0.01; ***P < 0.001.
Figure 11
Figure 11. Model of GATA2-regulated genome function, cytokine signaling, and progenitor differentiation.
GATA2 deficiency disrupts progenitor cell genome regulation. GATA2 loss decreases Csf2rb expression and GM-CSF signaling. GATA2, but not 9aa-Ins, elevates Csf2rb expression. GATA2 loss elevates Il6ra and Il6st expression and IL-6 signaling. WT GATA2, but not 9aa-Ins, reduces Il6ra and Il6st expression. These alterations impact differentiation and may impact function of progenitor-derived progeny. Normal progenitors exhibit predominantly granulocytic potential, and GM-CSF promotes granulopoiesis. IL-6 does not induce signaling in WT progenitors nor impact differentiation. GATA2-deficient progenitors exhibit predominantly monocytic (Mo) potential, and IL-6 promotes granulocytic (Gr), at the expense of monocytic, differentiation. GM-CSF does not induce signaling in GATA2-deficient progenitors nor impact differentiation. As CSF2RB and IL6ST are shared by additional receptors, their dysregulation will impact a broader ensemble of signaling systems to yield an aberrant network that may disrupt fetal hematopoiesis.

Similar articles

Cited by

References

    1. Klug A. The discovery of zinc fingers and their applications in gene regulation and genome manipulation. Annu Rev Biochem. 2010;79:213–231. doi: 10.1146/annurev-biochem-010909-095056. - DOI - PubMed
    1. Wu H, et al. Building zinc fingers by selection: toward a therapeutic application. Proc Natl Acad Sci U S A. 1995;92(2):344–348. doi: 10.1073/pnas.92.2.344. - DOI - PMC - PubMed
    1. Gillinder KR, et al. Promiscuous DNA-binding of a mutant zinc finger protein corrupts the transcriptome and diminishes cell viability. Nucleic Acids Res. 2017;45(3):1130–1143. doi: 10.1093/nar/gkw1014. - DOI - PMC - PubMed
    1. Lentaigne C, et al. Germline mutations in the transcription factor IKZF5 cause thrombocytopenia. Blood. 2019;134(23):2070–2081. doi: 10.1182/blood.2019000782. - DOI - PubMed
    1. Shaw-Smith C, et al. GATA4 mutations are a cause of neonatal and childhood-onset diabetes. Diabetes. 2014;63(8):2888–2894. doi: 10.2337/db14-0061. - DOI - PMC - PubMed

Publication types

MeSH terms

Substances