. 2023 Apr 11;51(6):2671-2690.
doi: 10.1093/nar/gkad058.

Comprehensive chromatin proteomics resolves functional phases of pluripotency and identifies changes in regulatory components

Affiliations

Comprehensive chromatin proteomics resolves functional phases of pluripotency and identifies changes in regulatory components

Enes Ugur et al. Nucleic Acids Res. .

Abstract

The establishment of cellular identity is driven by transcriptional and epigenetic regulators of the chromatin proteome - the chromatome. Comprehensive analyses of the chromatome composition and dynamics can therefore greatly improve our understanding of gene regulatory mechanisms. Here, we developed an accurate mass spectrometry (MS)-based proteomic method called Chromatin Aggregation Capture (ChAC) followed by Data-Independent Acquisition (DIA) and analyzed chromatome reorganizations during major phases of pluripotency. This enabled us to generate a comprehensive atlas of proteomes, chromatomes, and chromatin affinities for the ground, formative and primed pluripotency states, and to pinpoint the specific binding and rearrangement of regulatory components. These comprehensive datasets combined with extensive analyses identified phase-specific factors like QSER1 and JADE1/2/3 and provide a detailed foundation for an in-depth understanding of mechanisms that govern the phased progression of pluripotency. The technical advances reported here can be readily applied to other models in development and disease.


Figures

Graphical Abstract
Graphical Abstract
Proteomics method for comprehensive and accurate analysis of chromatin-associated proteins and its systematic application on pluripotent stem cells.
Figure 1.
Figure 1.
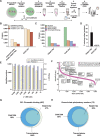
Chromatin aggregation capture (ChAC) followed by data-independent MS acquisition (DIA) enables near-complete chromatome identification and high-precision quantification. (A) Schematic workflow of ChAC-DIA. (B) Total numbers of identified proteins with representations of the coefficient of variation (CV) below 20% and 10%. ChAC-DIA results obtained in library-free mode by DIA-NN were benchmarked against a previous study based on the ChEP protocol (PRIDE: PXD011782). In both cases, mouse naive PSCs were used. (C) Total numbers of proteins falling into a gene ontology (GO) category. (D) Percentage of missing intensity values on protein level across replicates. (E) Total numbers of identified proteins and Pearson correlation coefficients of ChAC-DIA applied on different cell amounts. Pearson r reflects the correlation with the standard protocol comprising 15 Mio cells. (F) Protein abundance rank based on the ChAC-DIA-derived naive PSC chromatome. Chromatin binding proteins are highlighted in pink. Protein names in black indicate examples of bona fide pluripotency factors. Protein names in gray indicate other chromatin binders and the highest ranked nine proteins. (G) Venn diagram of proteins annotated as chromatin binding in ChAC-DIA, the compared study, and a transcriptome data set of naive PSCs (ArrayExpress: E-MTAB-6797). (H) Venn diagram of literature derived bona fide naive pluripotency factors identified by ChAC-DIA, the compared study, and a transcriptome data set of naive PSCs (ArrayExpress: E-MTAB-6797). See also Supplementary Figures S1 and S2.
Figure 2.
Figure 2.
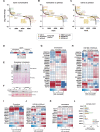
Chromatome mapping reveals a specific enrichment of chromatin-associated proteins in ground state PSCs. (A) Different fractions along the ChAC-DIA protocol were processed and measured. After ANOVA testing (FDR < 0.05, fold change difference ≥ 2) results were visualized in a heatmap generated by unsupervised hierarchical k-means clustering of z-scored intensities. In total nine clusters were identified. Proteins that are enriched only in the chromatome fractions are highlighted as the high-confidence chromatome. (B) Boxplot representation of row-scaled fold changes within each cluster. Cluster names are based on the most prominent GO-enriched terms (see Supplementary Figure 3E). (C) Principal component analysis (PCA) of the six different fractions. (D–H) Individual intensity profile plots of several proteins that are components of the WNT, LIF, GSK, FGF2 or Activin A pathways. See also Supplementary Figure S3.
Figure 3.
Figure 3.
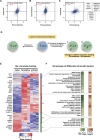
Chromatome atlas of mouse naive, formative, and primed pluripotent stem cells identifies groups of chromatin proteins with distinct binding patterns. (A) Schematic representation of compared cell lines and total significant changes between respective proteomes and chromatomes (Student's t-test, P value < 0.05, FC ≥ 2). (B) Heatmap representation of bona fide pluripotency factors. Fold changes are row-normalized by subtracting the mean log2 fold-change from each value. (C, D) Volcano plots of chromatomes based on Student's t-test displayed in (A). Light grey dots: not significantly enriched proteins. Black dots: significantly enriched proteins. Green dots: shared pluripotency factors. Blue dots: early differentiation markers. n = 3 biological replicates, meaning independently cultured/differentiated PSCs of the same genetic background. See also Supplementary Figures S4–S10.
Figure 4.
Figure 4.
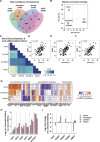
Identification of novel pluripotency phase-specific proteins through chromatome analysis. (AC) Protein rank based on the log2 fold change between naive versus formative (A), formative versus primed (B), or naive versus primed (C) PSC chromatomes. Bona fide pluripotency phase-specific proteins are highlighted alongside H3K4me3-, H3K9me3- or HBO1 complex-associated proteins. Light grey dots are not significantly changing proteins while dark grey dots are significantly changing. (D) Heatmap representation of QSER1 abundance in chromatomes and proteomes of naive, formative and primed PSCs. Each replicate value was normalized to the mean of the row. (E) Western Blot of QSER1 in the chromatome and the whole cell lysate and ponceau staining of the respective western blot membrane. (F) Western blot of H3K9me3 upon chaetocin treatment (0.1 μM) in WT and Suv39h1/2 double knockout (dko) mESCs at the naive and formative phase and ponceau staining of the respective western blot membrane. (D–J) Heatmap representation of H3K9me3- (G, H) and H3K4me3-associated (I, J) proteins and their abundance in chromatomes (G, I) and respective ChIP-MS experiments (H, J) of naive, formative and primed PSCs. Each replicate value was normalized to the mean of the row. (K) Heatmap representation of HBO1 complex proteins and their abundance in chromatomes of naive, formative, and primed PSCs. Each replicate value was normalized to the mean of the row. (L) Bar diagram of KAT7-normalized protein stoichiometries after KAT7 ChIP-MS in naive, formative, and primed PSCs. Error bars represent the standard deviation of independent triplicates. See also Supplementary Figure S11.
Figure 5.
Figure 5.
Relative chromatin binding reveals higher chromatin affinity of heterochromatic proteins in formative and primed PSCs. (A–C) Correlations of transcriptomes (ArrayExpress: E-MTAB-6797), proteomes, and chromatomes of formative vs naive PSCs of isogenic background (J1). Only proteins/mRNAs that were identified in both compared data sets are displayed. Pearson correlation coefficients are indicated in red. (D) Schematic representation of the relative chromatin binding concept. (E) Row z-scored relative chromatin binding changes between naive, formative, and primed PSCs filtered for ANOVA significant changes (FDR < 0.05, FC ≥ 2) and high-confidence chromatin binders. The relative chromatin binding was computed by subtracting the FC on chromatome level by the mean proteome FC of either formative versus naive or primed versus formative PSCs, respectively. (F) GO analyses of proteins enriched in clusters II, III or V of the hierarchical clustering from (E). As a comparison, the whole set of identified proteins was utilized.
Figure 6.
Figure 6.
The chromatome of conventionally cultured human ESCs is most similar to the mouse primed state. (A) Venn diagram of high-confidence chromatomes in all tested cell lines. The high-confidence chromatome was defined by a Student's T-test between each cell line's chromatome vs proteome (Student's t-test, P value < 0.05 and FC ≥ 1.5). (B) PCA of the high-confidence chromatomes of the tested four cell lines on relative chromatin binding level. (C) Pearson correlations of chromatomes filtered for literature-derived bona fide pluripotency and differentiation factors. (D–F) Scatter plots of one replicate of hESCs versus naive (D), formative (E) or primed PSCs (F) and Pearson correlation coefficient from (C) are displayed in red. (G) hESC-normalized chromatomes from each mouse PSC to hESCs in log2. The selection comprises bona fide pluripotency factors. (H) Relative chromatin bindings of a selection of heterochromatic proteins after normalization to their respective relative chromatin bindings in naive mESCs. The bars represent mean values and the error bar is based on the standard error of the mean. SUV39H1 was not identified in the full proteome of naive mESCs which is why the relative chromatin binding was imputed by a fixed value: 0. (I) Relative chromatin bindings of proteins related to the HIPPO signaling pathway in all analyzed cell lines. Bars represent mean values and the error bar is based on the standard error of the mean. See also Supplementary Figure S12.

Similar articles

Cited by

References

    1. Kinoshita M., Barber M., Mansfield W., Cui Y., Spindlow D., Stirparo G.G., Dietmann S., Nichols J., Smith A.. Capture of mouse and human stem cells with features of formative pluripotency. Cell Stem Cell. 2021; 28:453–471. - PMC - PubMed
    1. Takahashi S., Kobayashi S., Hiratani I.. Epigenetic differences between naïve and primed pluripotent stem cells. Cell. Mol. Life Sci. 2018; 75:1191–1203. - PMC - PubMed
    1. Smith A. Formative pluripotency: the executive phase in a developmental continuum. Development. 2017; 144:365–373. - PMC - PubMed
    1. Boroviak T., Loos R., Lombard P., Okahara J., Behr R., Sasaki E., Nichols J., Smith A., Bertone P.. Lineage-specific profiling delineates the emergence and progression of naive pluripotency in mammalian embryogenesis. Dev. Cell. 2015; 35:366–382. - PMC - PubMed
    1. Meshorer E., Yellajoshula D., George E., Scambler P.J., Brown D.T., Misteli T.. Hyperdynamic plasticity of chromatin proteins in pluripotent embryonic stem cells. Dev. Cell. 2006; 10:105–116. - PMC - PubMed

Publication types