. 2023 Feb 20;42(1):49.
doi: 10.1186/s13046-023-02616-1.

Water channel protein AQP1 in cytoplasm is a critical factor in breast cancer local invasion

Affiliations

Water channel protein AQP1 in cytoplasm is a critical factor in breast cancer local invasion

Zhifang Guo et al. J Exp Clin Cancer Res. .

Abstract

Background: Metastasis of breast cancer grows from the local invasion to the distant colonization. Blocking the local invasion step would be promising for breast cancer treatment. Our present study demonstrated AQP1 was a crucial target in breast cancer local invasion.

Methods: Mass spectrometry combined with bioinformatics analysis was used to identify AQP1 associated proteins ANXA2 and Rab1b. Co-immunoprecipitation, immunofluorescence assays and cell functional experiments were carried out to define the relationship among AQP1, ANXA2 and Rab1b and their re-localization in breast cancer cells. The Cox proportional hazards regression model was performed toward the identification of relevant prognostic factors. Survival curves were plotted by the Kaplan-Meier method and compared by the log-rank test.

Results: Here, we show that the cytoplasmic water channel protein AQP1, a crucial target in breast cancer local invasion, recruited ANXA2 from the cellular membrane to the Golgi apparatus, promoted Golgi apparatus extension, and induced breast cancer cell migration and invasion. In addition, cytoplasmic AQP1 recruited cytosolic free Rab1b to the Golgi apparatus to form a ternary complex containing AQP1, ANXA2, and Rab1b, which induced cellular secretion of the pro-metastatic proteins ICAM1 and CTSS. Cellular secretion of ICAM1 and CTSS led to the migration and invasion of breast cancer cells. Both in vivo assay and clinical analysis data confirmed above results.

Conclusions: Our findings suggested a novel mechanism for AQP1-induced breast cancer local invasion. Therefore, targeting AQP1 offers promises in breast cancer treatment.

Keywords: AQP1; Breast cancer; Metastasis.


Conflict of interest statement

All authors declare that they have no conflict of interest.

Figures
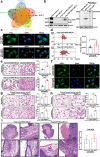
Fig. 1
Fig. 1
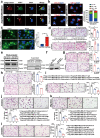
Water channel protein AQP1 mainly localized in the cytoplasm of breast cancer and it was crucial for breast cancer local invasion. a A Venn diagram showed several candidate molecules potentially regulating breast cancer progression based on a combination analysis of five gene expression profiles. b Western blot analysis of AQP1 expression in kidney tissues and MDA-MB-231 cells with two different tags. Kidney tissues were used as a positive control and β-actin was the loading control. c Representative immunofluorescence images of AQP1 localization in MDA-MB-231 cells with two different tags. Scale bar = 20 μm. d Migration tracks of MDA-MB-231 cells stably transfected with control (Flag-vector) or AQP1 (Flag-AQP1) and images were captured every 30 min for 6.5 h. Bar graphs show quantification of cell speed (right). Error bars represent SEM of 3 independent experiments (two-tailed Student’s t test, *P < 0.05). e The abilities of migration and invasion were detected using Flag-vector/MDA-MB-231 and Flag-AQP1/MDA-MB-231 cells. Values were expressed as mean ± SEM from three independent experiments (two-tailed Student’s t test, *P < 0.05, ***P < 0.001). Scale bar = 100 μm. f Immunofluorescence images showed that AQP1 localized in cytoplasm of two primary breast cancer cells. Scale bar = 20 μm. g, h Representative migration or invasion images of control group and AQP1-overexpressing primary breast cancer cells. Values were expressed as mean ± SEM from three independent experiments (two-tailed Student’s t test, *P < 0.05, **P < 0.01). Scale bar = 100 μm. i Representative images of hematoxylin–eosin staining in xenograft paraffin specimens, part of square 1/2/3 was enlarged in picture 1/2/3 respectively (muscle involvement: black arrow, Satellite nodules: red arrow, adipocytes involvement: yellow arrow). N = 12/group. The score of xenografts invasion in mice was analyzed quantitatively. All in vitro experiments were repeated at least 3 times
Fig. 2
Fig. 2
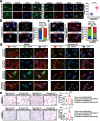
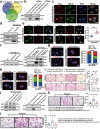
AQP1 localized in the Golgi apparatus and induced cell secretion of ICAM1 and CTSS, leading to the cell local invasion. a Immunofluorescent staining of AQP1 and Golgi marker GM130 or Golgi tracker in Flag-AQP1/MDA-MB-231 cells. Scale bar = 20 μm. b Immunofluorescent staining of GM130/TGN46 together with staining of DAPI in Flag-vector/MDA-MB-231 and Flag-AQP1/MDA-MB-231 cells. In the right panel showed the distribution of cells with different ranges of Golgi ribbon angle (Ɵ: 0°–360°) (n = 80–90 cells per group, ***P < 0.001). Scale bar = 20 μm. c Trafficking of TS045-VSVG-EGFP in Flag-vector/hela and Flag-AQP1/hela cells (two-tailed Student’s t test, *P < 0.05). Scale bar = 20 μm. d Migration and invasion assays showed that Flag-vector/MDA-MB-231 cells treated with the supernatant of Flag-AQP1/MDA-MB-231 cells exhibited the promoted phenotype compared with Flag-vector/MDA-MB-231 cells (two-tailed Student’s t test, *P < 0.05). Each bar represented the mean ± SEM from three independent experiments. Scale bar = 100 µm. e Western blot analysis to detect the expression of CTSS and ICAM1 in the whole cell lysates and supernatant medium of Flag-vector/MDA-MB-231 cells and Flag-AQP1/MDA-MB-231 cells. β-actin was the loading control. f Western blot of ICAM1 expression in control and ICAM1-downexpressing cells. g Representative migration or invasion images of control and ICAM1-downexpressing groups (two-tailed Student’s t test, *P < 0.05, **P < 0.01). Scale bar = 100 µm. h Representative migration or invasion images of control and CTSS inhibition groups (two-tailed Student’s t test, **P < 0.01). Scale bar = 100 µm. i, j Representative migration or invasion images from Flag-vector/MDA-MB-231 cells treated with the supernatant medium samples plus 5 µg/ml or 10 µg/ml ICAM1 neutralizing antibody (anti-ICAM1) or control IgG (two-tailed Student’s t test, *P < 0.05, **P < 0.01, ***P < 0.001). Each bar represented the mean ± SEM from three independent experiments. Scale bar = 100 µm. k, l Representative migration or invasion images from Flag-vector/MDA-MB-231 cells treated with the supernatant medium samples plus 5 µl or 10 µl CTSS neutralizing antibody (anti-CTSS) or control IgG (two-tailed Student’s t test, *P < 0.05, **P < 0.01, ***P < 0.001). Each bar represented the mean ± SEM from three independent experiments. Scale bar = 100 µm. All in vitro experiments were repeated at least 3 or 4 times
Fig. 3
Fig. 3
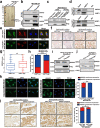
AQP1 interacted with ANXA2 and recruited it from the cell membrane to the cytoplasm. a Cellular extracts from MDA-MB-231 cells stably transfected Flag-vector or Flag-AQP1 were immunopurified with anti-Flag affinity beads and eluted with Flag peptides. The eluates were resolved on SDS-PAGE and silver-stained followed by mass spectrometry analysis. b-c Immunoprecipitation experiments were performed by using an anti-flag M2 affinity gel and then immunoblotted with ANXA2 or AQP1 antibodies. d Whole cell lysates from Flag-AQP1/MDA-MB-231 cells were immunoprecipitated with anti-ANXA2 or anti-AQP1 and then immunoblotted with antibodies against the indicated proteins. e Immunofluorescence analysis showed the colocalization of AQP1 and ANXA2 in GFP-AQP1/MDA-MB-231 and Flag-AQP1/MDA-MB-231 cells. Scale bar = 20 μm. f Immunohistochemical staining of 194 serial paraffin sections was performed to detect the expression of AQP1 and ANXA2. Scale bar = 100 μm. g Cytoplasmic ANXA2 score in AQP1 high expression group was higher than in AQP1 low expression group in 194 serial paraffin sections (two-tailed Student’s t test, P = 0.0034, **P < 0.01). h 70.2% (59/84) IDC patients exhibited high ANXA2 cytoplasmic expression in AQP1 high cytoplasmic expression group, while the percent of high ANXA2 cytoplasmic expression cases was only 33.6% (37/110) in AQP1 low cytoplasmic expression group (Chi-square test, P = 0.000, ***P < 0.001). i Western blot analysis of ANXA2 expression in Flag-vector/MDA-MB-231 and Flag-AQP1/MDA-MB-231 cells. j Western blot analysis of cytoplasmic ANXA2 expression in the cytosol of Flag-vector/MDA-MB-231 and Flag-AQP1/MDA-MB-231 cells. k Immunofluorescent assay showed the cellular location of ANXA2 in Flag-vector/MDA-MB-231 and Flag-AQP1/MDA-MB-231 cells (n = 194–197 cells per group, Chi-square test, ***P < 0.001). Scale bar = 20 μm. l Immunohistochemical staining of 194 serial paraffin sections was performed to detect the expression of AQP1 and ANXA2. 21.8% (24/110) IDC patients exhibited ANXA2 membrane expression in AQP1 low cytoplasmic expression group, while the percent of ANXA2 membrane expression cases was only 10.7% (9/84) in AQP1 high cytoplasmic expression group (Chi-square test, P = 0.041, *P < 0.05). Scale bar = 100 μm. All in vitro experiments were repeated at least 3 times
Fig. 4
Fig. 4
AQP1 recruited ANXA2 to the Golgi apparatus and promoted the Golgi extension through F-actin by interaction with ANXA2, inducing breast cancer cell invasion. a Immunofluorescent assay showed the colocalization of ANXA2 and GM130 in Flag-vector/MDA-MB-231 and Flag-AQP1/MDA-MB-231 cells (n = 30 cells per group, two-tailed Student’s t test, ***P < 0.001). Scale bar = 20 μm. b-c Immunofluorescent staining of GM130/TGN46 and DAPI in 4 different cell clones. In the right panel showed the distribution of cells with different ranges of Golgi ribbon angle (Ɵ: 0°–360°), respectively (n = 74–97 cells per group, ***P < 0.001). Scale bar = 20 μm. d Flag-AQP1/MDA-MB-231 cells showed extended Golgi morphology (GM130, green) and normal F-actin (Texas red phalloidin). When treated with latrunculin B, Flag-AQP1/MDA-MB-231 cells exhibited loss of F-actin (stress fibers and peripheral actin) and Golgi condensation. Flag-AQP1/shANXA2 #1/MDA-MB-231 cells also reversed the extended Golgi morphology when treatment with latrunculin B. Scale bar = 20 μm. e The abilities of migration and invasion were detected using four indicated cells. Each bar represented the mean ± SEM from three or four independent experiments (two-tailed Student’s t test, *P < 0.05, **P < 0.01). Scale bar = 100 µm. All in vitro experiments were repeated at least 3 or 4 times
Fig. 5
Fig. 5
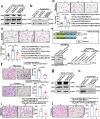
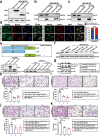
The interaction of the NT-6 × helix domain of AQP1 with ANXA2 induced cell secretion of ICAM1 and CTSS, leading to cell local invasion. a Western blot analysis to detect the expression of CTSS and ICAM1 in the whole cell lysates of Flag-vector/MDA-MB-231 cells, Flag-AQP1/MDA-MB-231 cells and Flag-AQP1/shANXA2 #1/MDA-MB-231 cells. β-actin was the loading control. b Western blot analysis of the supernatant medium samples isolated from 3 indicated cells was performed to quantify ICAM1 and CTSS proteins. c-d Representative migration or invasion images from Flag-vector/MDA-MB-231 cells treated with 3 different supernatant medium samples (two-tailed Student’s t test, *P < 0.05). Each bar represented the mean ± SEM from three independent experiments. Scale bar = 100 µm. e Co-immunoprecipitation experiments were performed to illustrated the interaction between AQP1-NT-6 × helix and ANXA2. The Flag-AQP1-CT/MDA-MB-231 cells were also tagged with GFP. f The abilities of migration and invasion were detected using Flag-AQP1/MDA-MB-231 and Flag-AQP1-∆NT-6 × helix/MDA-MB-231 cells. Each bar represented the mean ± SEM from four independent experiments (two-tailed Student’s t test, ***P < 0.001). Scale bar = 100 µm. g Western blot analysis to detect the expression of CTSS and ICAM1 in the whole cell lysates of Flag-AQP1/MDA-MB-231 cells and Flag-AQP1-∆NT-6 × helix/MDA-MB-231 cells. β-actin was the loading control. h Western blot analysis of the supernatant medium samples in 2 indicated cells. i-j Representative migration or invasion images from Flag-vector/MDA-MB-231 cells treated with the supernatant medium of Flag-AQP1/MDA-MB-231 cells and that of Flag-AQP1-∆NT-6 × helix/MDA-MB-231 cells (two-tailed Student’s t test, *P < 0.05, **P < 0.01). Each bar represented the mean ± SEM from three independent experiments. Scale bar = 100 µm. All in vitro experiments were repeated at least 3 or 4 times
Fig. 6
Fig. 6
Rab1b was shown necessary for the AQP1-induced ICAM1/CTSS secretion. a The Venn diagram showed the intersection of three datasheets using 817 RNA-seq data from TCGA database. b Immunoprecipitation experiments were performed by using an anti-Flag M2 affinity gel and then immunoblotted with anti-Rab1b or anti-Flag. c Immunofluorescent staining of Flag together with Rab1b in Flag-AQP1/MDA-MB-231 cells. Scale bar = 20 µm. d Western blot analysis of Rab1b expression in Flag-vector/MDA-MB-231 and Flag-AQP1/MDA-MB-231 cells. e Immunofluorescent assay showed the cellular location of Rab1b in Flag-vector/MDA-MB-231 and Flag-AQP1/MDA-MB-231 cells (n = 60 cells per group, two-tailed Student’s t test, ***P < 0.001). Scale bar = 20 μm. f Western blot analysis of indicated cell clones. Scr/MDA-MB-231 and Flag-vector/scr/MDA-MB-231 cells were used as control. g-h Immunofluorescent staining of GM130/TGN46 and DAPI in 4 different cell clones. In the right panel showed the distribution of cells with different ranges of Golgi ribbon angle (Ɵ: 0°–360°), respectively. **P < 0.01, ***P < 0.001. Scale bar = 20 μm. i The abilities of migration and invasion were detected using 4 indicated cell clones. Quantitative results were analyzed in the right panel. Each bar represented the mean ± SEM from three independent experiments (two-tailed Student’s t test, *P < 0.05, **P < 0.01, ***P < 0.001). Scale bar = 100 μm. j Western blot analysis of the whole cell lysates or supernatant medium samples isolated from 3 indicated cells was performed to quantify ICAM1 and CTSS proteins. k-l Representative migration (k) or invasion (l) images from Flag-vector/MDA-MB-231 cells treated with the supernatant medium 3 different cells (two-tailed Student’s t test, *P < 0.05, **P < 0.01). Each bar represented the mean ± SEM from three independent experiments. Scale bar = 100 µm. All in vitro experiments were repeated at least 3 times
Fig. 7
Fig. 7
AQP1, ANXA2 and Rab1b formed a ternary complex. a Western blot analysis of MDA-MB-231 cells stably transfected Flag-vector, Flag-Rab1b and Flag-ANXA2 was performed using anti-flag and anti-β-actin antibodies. b-c Co-immunoprecipitation experiments confirmed the interactions between ANXA2 and Rab1b. d The colocalization of ANXA2 and Rab1b were detected in Flag-vector/MDA-MB-231 cells and Flag-AQP1/MDA-MB-231 cells by Immunofluorescence experiments (n = 166–178 cells per group, two-tailed Student’s t test, ***P < 0.001). Scale bar = 20 μm. e Co-immunoprecipitation experiments confirmed the interactions between ANXA2 and the different domain structure fragments of Rab1b. The Flag-Rab1b-NT/HEK-293 T and Flag-Rab1b-CT/HEK-293 T cells were also tagged with GFP. f Western blot was conducted to determine the expression of Rab1b in MDA-MB-231 cells transfected with si-Rab1b. NC: negative control. g Western blot analysis of Flag-AQP1/si-Rab1b #6/MDA-MB-231 cells transfected Flag-Rab1b-∆CT. Flag-Rab1b-∆CT/MDA-MB-231 cells were also tagged with GFP. h-i The abilities of migration and invasion were detected using Flag-AQP1/siRab1b #6/MDA-MB-231 and Flag-AQP1/siRab1b #6/Rab1b-∆CT/MDA-MB-231 cells. Each bar represented the mean ± SEM from three or four independent experiments (two-tailed Student’s t test, **P < 0.01, ***P < 0.001). Scale bar = 100 μm. j-k The abilities of migration and invasion were detected using cell supernatants medium of Flag-AQP1/siRab1b #6/MDA-MB-231 and Flag-AQP1/siRab1b #6/Rab1b-∆CT/MDA-MB-231 cells. Each bar represented the mean ± SEM from three independent experiments (two-tailed Student’s t test, *P < 0.05, **P < 0.01). Scale bar = 100 μm. All in vitro experiments were repeated at least 3 or 4 times
Fig. 8
Fig. 8
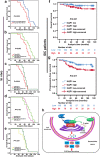
Both in vivo assay and clinical analysis data confirmed that AQP1 induced breast cancer progression by interacting with ANXA2 and Rab1b. a-e Survival times between animal groups were compared (log-rank test). The Flag-AQP1/MDA-MB-231 (n = 20) mice group had a shorter survival time compared with Flag-vector/MDA-MB-231 (n = 14) mice group (a); Flag-AQP1/shANXA2 #1/MDA-MB-231 (n = 17) mice group (b) and Flag-AQP1/shRab1b #1/MDA-MB-231 (n = 20) mice group (c) also had a longer survival time when compared with Flag-AQP1/MDA-MB-231 (n = 20) mice group; The survival time was not changed between shANXA2 #1/MDA-MB-231 (n = 19) and Flag-AQP1/shANXA2 #1/MDA-MB-231 (n = 17) mice group (d); Comparison of survival curve between shRab1b #1/MDA-MB-231 (n = 20) and Flag-AQP1/shRab1b #1/MDA-MB-231 (n = 20) mice group (e). f, g Kaplan–Meier analysis of survival of 194 IDC patients with AQP1 high cytoplasmic expression or AQP1 low cytoplasmic expression (log-rank test). h Overview of the AQP1/ANXA2/Rab1b signaling pathway in breast cancer local invasion

Similar articles

Cited by

References

    1. Rahman M, Mohammed S. Breast cancer metastasis and the lymphatic system. Oncol Lett. 2015;10:1233–1239. doi: 10.3892/ol.2015.3486. - DOI - PMC - PubMed
    1. Valastyan S, Weinberg RA. Tumor metastasis: molecular insights and evolving paradigms. Cell. 2011;147:275–292. doi: 10.1016/j.cell.2011.09.024. - DOI - PMC - PubMed
    1. Hoque MO, Soria JC, Woo J, Lee T, Lee J, Jang SJ, Upadhyay S, Trink B, Monitto C, Desmaze C, et al. Aquaporin 1 is overexpressed in lung cancer and stimulates NIH-3T3 cell proliferation and anchorage-independent growth. Am J Pathol. 2006;168:1345–1353. doi: 10.2353/ajpath.2006.050596. - DOI - PMC - PubMed
    1. Pelagalli A, Nardelli A, Fontanella R, Zannetti A. Inhibition of AQP1 hampers osteosarcoma and hepatocellular carcinoma progression mediated by bone marrow-derived mesenchymal stem cells. Int J Mol Sci. 2016;17:1102. doi: 10.3390/ijms17071102. - DOI - PMC - PubMed
    1. Esteva-Font C, Jin BJ, Verkman AS. Aquaporin-1 gene deletion reduces breast tumor growth and lung metastasis in tumor-producing MMTV-PyVT mice. FASEB J. 2014;28:1446–1453. doi: 10.1096/fj.13-245621. - DOI - PMC - PubMed