[Preprint]. 2023 Aug 4:2023.02.09.527892.
doi: 10.1101/2023.02.09.527892.

Long COVID manifests with T cell dysregulation, inflammation, and an uncoordinated adaptive immune response to SARS-CoV-2

Affiliations

Long COVID manifests with T cell dysregulation, inflammation, and an uncoordinated adaptive immune response to SARS-CoV-2

Kailin Yin et al. bioRxiv. .

Update in

Abstract

Long COVID (LC), a type of post-acute sequelae of SARS-CoV-2 infection (PASC), occurs after at least 10% of SARS-CoV-2 infections, yet its etiology remains poorly understood. Here, we used multiple "omics" assays (CyTOF, RNAseq/scRNAseq, Olink) and serology to deeply characterize both global and SARS-CoV-2-specific immunity from blood of individuals with clear LC and non-LC clinical trajectories, 8 months following infection and prior to receipt of any SARS-CoV-2 vaccine. Our analysis focused on deep phenotyping of T cells, which play important roles in immunity against SARS-CoV-2 yet may also contribute to COVID-19 pathogenesis. Our findings demonstrate that individuals with LC exhibit systemic inflammation and immune dysregulation. This is evidenced by global differences in T cell subset distribution in ways that imply ongoing immune responses, as well as by sex-specific perturbations in cytolytic subsets. Individuals with LC harbored increased frequencies of CD4+ T cells poised to migrate to inflamed tissues, and exhausted SARS-CoV-2-specific CD8+ T cells. They also harbored significantly higher levels of SARS-CoV-2 antibodies, and in contrast to non-LC individuals, exhibited a mis-coordination between their SARS-CoV-2-specific T and B cell responses. RNAseq/scRNAseq and Olink analyses similarly revealed immune dysregulatory mechanisms, along with non-immune associated perturbations, in individuals with LC. Collectively, our data suggest that proper crosstalk between the humoral and cellular arms of adaptive immunity has broken down in LC, and that this, perhaps in the context of persistent virus, leads to the immune dysregulation, inflammation, and clinical symptoms associated with this debilitating condition.


Conflict of interest statement

CONFLICTS OF INTERESTS MJP reports consulting fees from Gilead Sciences and AstraZeneca, outside the submitted work. SGD reports grants and/or personal fees from Gilead Sciences, Merck & Co., Viiv, AbbVie, Eli Lilly, ByroLogyx, and Enochian Biosciences, outside the submitted work. TJH receives grant support from Merck and consults for Roche. All other authors report no potential conflicts.

Figures

Fig. 1.
Fig. 1.. Study Design.
Schematic of experimental design and data analyses. Plasma and sera from 27 individuals with Long COVID (LC) and 16 individuals without LC (Non-LC) were subjected to Olink and serological analyses. PBMCs from the same individuals were subjected to RNAseq/scRNAseq analysis, as well as to CyTOF analysis at baseline, or following a 6-hour stimulation with peptides derived from SARS-CoV-2 spike proteins (see Methods) to analyze T cell responses. The cells for CyTOF were treated with viability marker, fixed, and stained with a 39-parameter panel (Table S2) prior to analysis on a CyTOF instrument. The indicated tools on the right were then used for analyses of the resulting high-dimensional datasets.
Fig. 2.
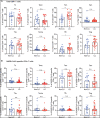
Fig. 2.. Identification and characterization of SARS-CoV-2-specific T cells in individuals from the LIINC cohort.
A. SARS-CoV-2-specific CD4+ T cells can be identified as those producing IFNγ, TNFα, or IL2 in response to SARS-CoV-2 peptide stimulation. Cells were analyzed by intracellular cytokine staining in the absence (top row) or presence (bottom row) of SARS-CoV-2 peptides. B. SARS-CoV-2-specific CD8+ T cells can be identified as those producing IFNγ, TNFα, or MIP1β in response to SARS-CoV-2 peptide stimulation. Cells were analyzed by intracellular cytokine staining in the absence (top row) or presence (bottom row) of SARS-CoV-2 peptides. C, D. No significant differences in the magnitude of the T cell responses were observed between LC and non-LC individuals within the CD4+ (C) or CD8+ (D) T cell compartments (student’s t-tests). E. Analysis of polyfunctionality of SARS-CoV-2-specific CD4+ T cells. SPICE analysis revealed that polyfunctional SARS-CoV-2-specific CD4+ T cells co-expressing IFNγ, IL2, and TNFα (category 1) trended higher in non-LC than LC individuals albeit insignificantly (permutation test). TNFα single positive cells (category 7) made up the vast majority of SARS-CoV-2-specific CD4+ T cells in both LC and non-LC individuals. F. Analysis of polyfunctionality of SARS-CoV-2-specific CD8+ T cells. SPICE analysis revealed that polyfunctional SARS-CoV-2-specific CD8+ T cells co-expressing IFNγ, MIP1β, and TNFα (category 1) trended higher in non-LC than LC individuals albeit insignificantly (permutation test). TNFα single positive cells (category 7) made up the majority of SARS-CoV-2-specific CD8+ T cells in both LC and non-LC individuals, but to a lesser extent than for SARS-CoV-2-specific CD4+ T cells. Relative to SARS-CoV-2-specific CD4+ T cells, SARS-CoV-2-specific CD8+ T cells more frequently produced IFNγ.
Fig 3.
Fig 3.. Tcm, Tfh, and Treg frequencies differ between LC and Non-LC individuals.
A. CD4+ T cell subset analysis reveals higher proportions of Tcm, Tfh, and Treg in LC vs. non-LC individuals. **p<0.01, *p<0.05 (student’s t-test). B. No significant differences were observed in the proportion of the indicated SARS-CoV-2-specific CD4+ T cell subsets between LC vs. non-LC individuals. Phenotypic definition of subsets were as follows: naïve T cells (Tn): CD45RA+CD45RO-CCR7+CD95-, stem cell memory T cells (Tscm): CD45RA+CD45ROCCR7+CD95+, central memory T cells (Tcm): CD45RA-CD45RO+CCR7+CD27+, effector memory T cells (Tem): CD45RA-CD45RO+CCR7-CD27-, transitional memory T cells (Ttm): CD45RA-CD45RO+CCR7-CD27+, effector memory RA T cells (Temra): CD45RA+CD45ROCCR7-, T follicular helper cells (Tfh): CD45RA-CD45RO+PD1+CXCR5+, and regulatory T cells (Treg): CD45RA-CD45RO+CD127-CD25+.
Fig. 4.
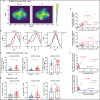
Fig. 4.. SARS-CoV-2-specific CD4+ T cells from individuals with LC preferentially express homing receptors associated with migration to inflamed tissues.
A. tSNE contour depiction of SARS-CoV-2-specific CD4+ T cells from LC and non-LC individuals, highlighting different distribution of cells from the two groups. B. Expression of the chemokine receptors CXCR4, CXCR5, and CCR6 are elevated in SARS-CoV-2-specific CD4+ T cells from LC as compared to non-LC individuals. MSI corresponds to mean signal intensity of the indicated markers’ expression level, reported as arcsinh-transformed CyTOF data as detailed in the Methods. C, D. CXCR4+CXCR5+ and CXCR5+CCR6+ SARS-CoV-2-specific (C) and total (D) CD4+ T cells are significantly elevated in LC as compared to non-LC individuals, while their CXCR4+CCR6+ counterparts trended higher in the LC group. *p<0.05 (student’s t-test). E. The frequencies of CXCR4+CXCR5+ and CXCR5+CCR6+ CD4+ T cells are significantly positively associated (p<0.0001 for CXCR4+CXCR5+, p<0.001 for CXCR5+CCR6+) with the frequencies of Tfh in LC, but not non-LC, individuals. F. The frequencies of SARS-CoV-2-specific CXCR4+CXCR5+ and CXCR5+CCR6+ CD4+ T cells are significantly positively associated (p<0.0001 for CXCR4+CXCR5+, p<0.0001 for CXCR5+CCR6+) with the frequencies of SARS-CoV-2-specific Tfh in LC, but not non-LC, individuals. In panels E-F, correlation estimates were identified as R values (Pearson correlation coefficients).
Fig. 5.
Fig. 5.. SARS-CoV-2-specific CD8+ T cells from individuals with LC preferentially express exhaustion markers PD1 and CTLA4.
A. tSNE contour depiction of SARS-CoV-2-specific CD8+ T cells from LC and non-LC individuals, highlighting different distribution of cells from the two groups. B. Expression of exhaustion markers PD1 and CTLA4, but not TIGIT, are elevated on SARS-CoV-2-specific CD8+ T cells from LC as compared to non-LC individuals. MSI corresponds to mean signal intensity of the indicated markers’ expression level. C, D. PD1+CTLA4+ cells are significantly enriched among SARS-CoV-2-specific CD8+ T cells (C) but not total CD8+ T cells (D) in LC as compared to non-LC individuals. By contrast, TIGIT+CTLA4+ and PD1+TIGIT+ total and SARS-CoV-2-specific CD8+ T cells were equivalently distributed between LC and non-LC individuals. *p<0.05 (student’s t-test).
Fig. 6.
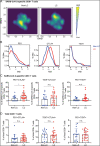
Fig. 6.. Dis-coordinated humoral and adaptive immunity in individuals with LC.
A. SARSCoV-2 spike RBD antibody levels are elevated in LC as compared to non-LC individuals. *p<0.05 (student’s t-test). B. Individuals with LC harboring the highest humoral response (green oval) are not those exhibiting highest levels of exhausted PD1+CTLA4+ SARS-CoV-2-specific CD8+ T cells (purple oval). C. Frequencies of PD1+CTLA4+ SARS-CoV-2-specific CD8+ T cells and SARS-CoV-2-specific CD4+ Treg cells are negatively associated only in individuals with LC. D-F. SARS-CoV-2 spike RBD antibody levels are significantly positively associated with the frequencies of SARS-CoV-2-specific CD4+ T cells (D), SARS-CoV-2-specific Tfh (E), and SARS-CoV-2-specific CD8+ T cells (F) in non-LC individuals, but not in individuals with LC. In panels D-F, the correlation estimates (identified as R in the figures) for the non-LC group were significantly (p<0.05 for the CD4+ T cells, p<0.01 for Tfh cells, p<0.001 for the CD8+ T cells) different from zero while the corresponding estimates were n.s. (p>0.05) for the LC group (Pearson r t-tests).
Fig. 7.
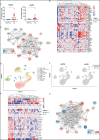
Fig. 7.. Global differential gene and gene product expression in participants with and without LC.
A. Relative gene expression levels of top two significantly differentially expressed genes (DEGs) from bulk RNAseq analysis of LC vs. non-LC individuals. OR7D2 corresponds to Olfactory Receptor family 7D2 (log2 fold-change=3.63), and ALAS2 to 5’Aminolevulinate Synthase 2 (log2 fold-change=2.58). *p < 0.05 (Wald test, with Benjamini-Hochberg correction). Purple asterisks identify the female donors selected for follow-up scRNAseq analyses. B. Clustered heatmap of the top 50 DEGs in PBMCs in LC compared to non-LC individuals. Genes are grouped into k-clusters based on similarity. Note four modules of gene expression, with the second corresponding to immunoglobulin and T cell genes (under-expressed in LC), and the third corresponding to heme synthesis and carbon dioxide transport (over-expressed in LC). C. Network mapping of related DEGs from bulk RNAseq analysis. Each node corresponds to a gene, and colors of nodes indicate the extent of change as indicated in the heatmap scale bar, with red corresponding to upregulation in individuals with LC, and blue corresponding to downregulation in individuals with LC. Edges depict the functional relevance between pairs of genes, where the thickness of the edge corresponds to the confidence of the evidence. The highly networked nature of the indicated genes supports their association with LC. D. UMAP of annotated clusters from samples analyzed by scRNAseq. E. Both OR7D2 and ALAS2 are broadly expressed among PBMC subsets of individuals with LC. Shown are UMAP depictions of cells expressing (blue) or not expressing (grey) OR7D2 or ALAS2 as indicated. F. Clustered heatmap of the top 25 differentially expressed plasma proteins from Olink Proximity Extension Assay with markers grouped into k-clusters based on similarity. Note a dominant module of inflammatory-related genes including LGALS9, CCL21, CCL22, TNF, CXCL10, and CD48. G. Network mapping of related differentially expressed proteins as detected by Olink. Graph representations are as described in panel C. Note the simultaneous over-expression of IL4 and CCL22 (in red) with under-expression of IL5 (in blue), all three proteins of which are involved in Th2 immune responses.

Similar articles

References

    1. Nalbandian A. et al. Post-acute COVID-19 syndrome. Nat. Med. (2021). - PMC - PubMed
    1. Peluso M.J. & Deeks S.G. Early clues regarding the pathogenesis of long-COVID. Trends Immunol. 43, 268–270 (2022). - PMC - PubMed
    1. Davis H.E., McCorkell L., Vogel J.M. & Topol E.J. Long COVID: major findings, mechanisms and recommendations. Nature Reviews Microbiology, 1–14 (2023). - PMC - PubMed
    1. Azzolini E. et al. Association Between BNT162b2 Vaccination and Long COVID After Infections Not Requiring Hospitalization in Health Care Workers. JAMA (2022). - PMC - PubMed
    1. Ayoubkhani D. et al. Trajectory of long covid symptoms after covid-19 vaccination: community based cohort study. BMJ 377, e069676 (2022). - PMC - PubMed

Publication types