

Rise and fall of SARS-CoV-2 variants in Rotterdam: Comparison of wastewater and clinical surveillance
- PMID: 36796689
- PMCID: PMC9927792
- DOI: 10.1016/j.scitotenv.2023.162209
Rise and fall of SARS-CoV-2 variants in Rotterdam: Comparison of wastewater and clinical surveillance
Abstract
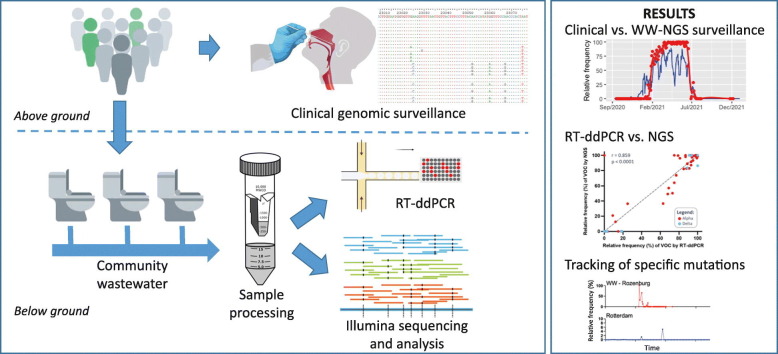
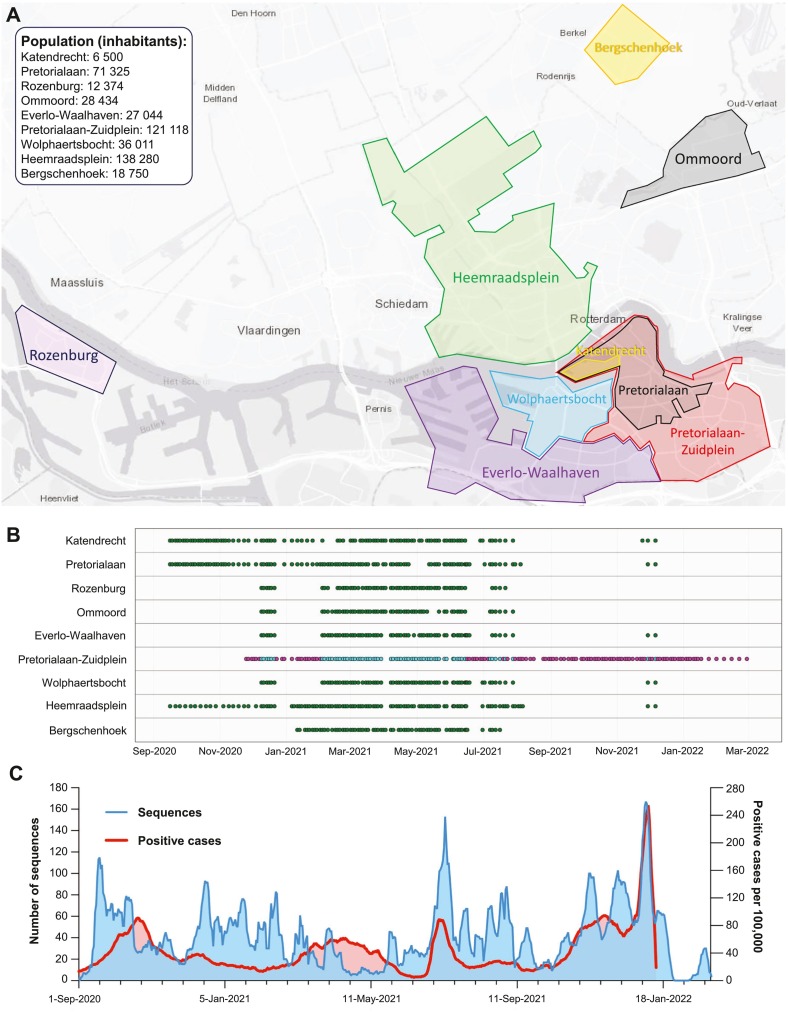
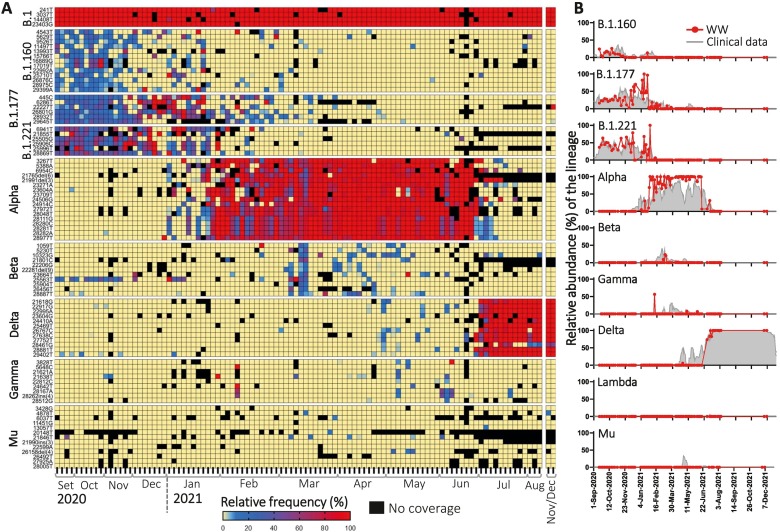
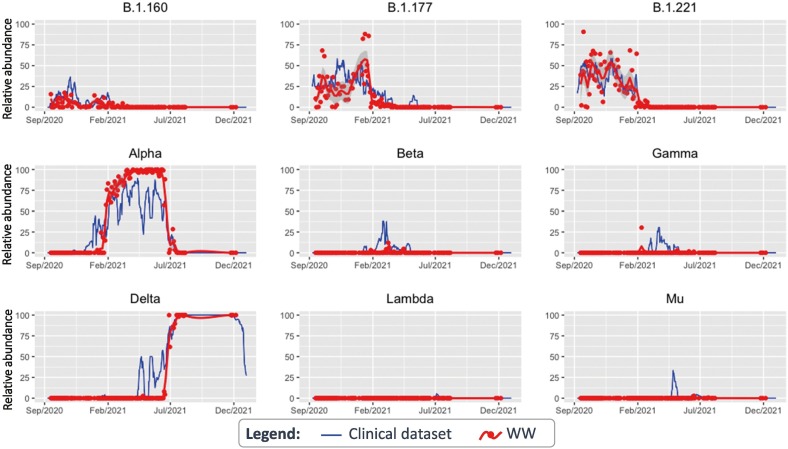
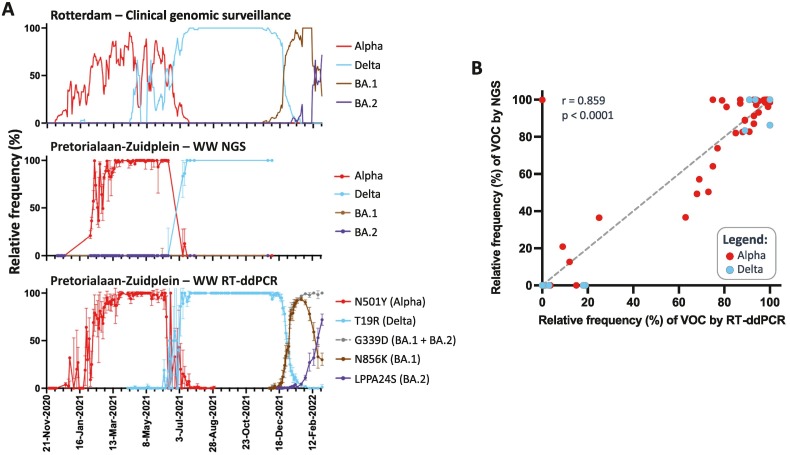
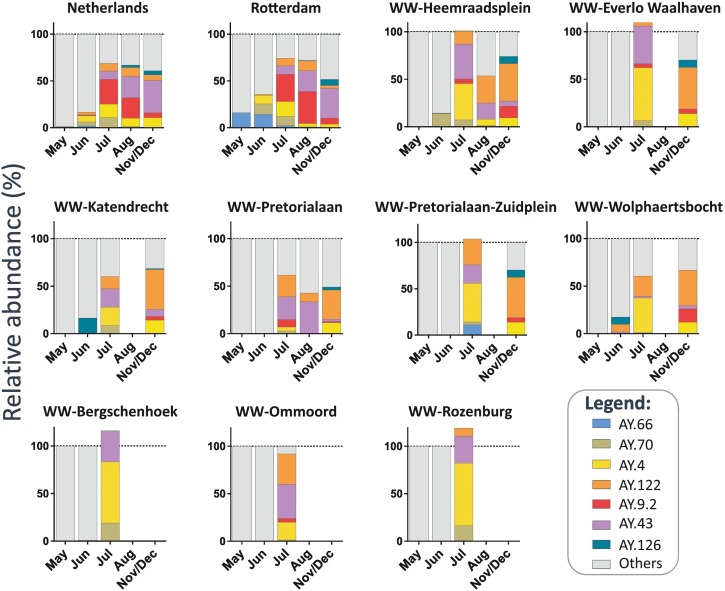
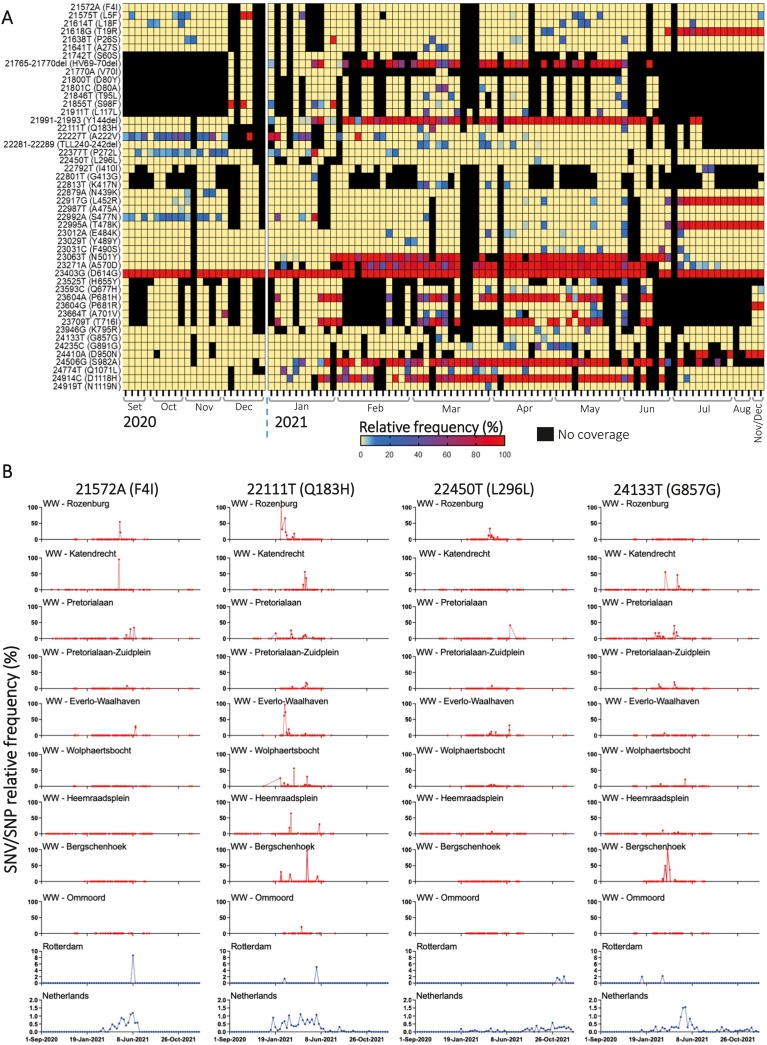
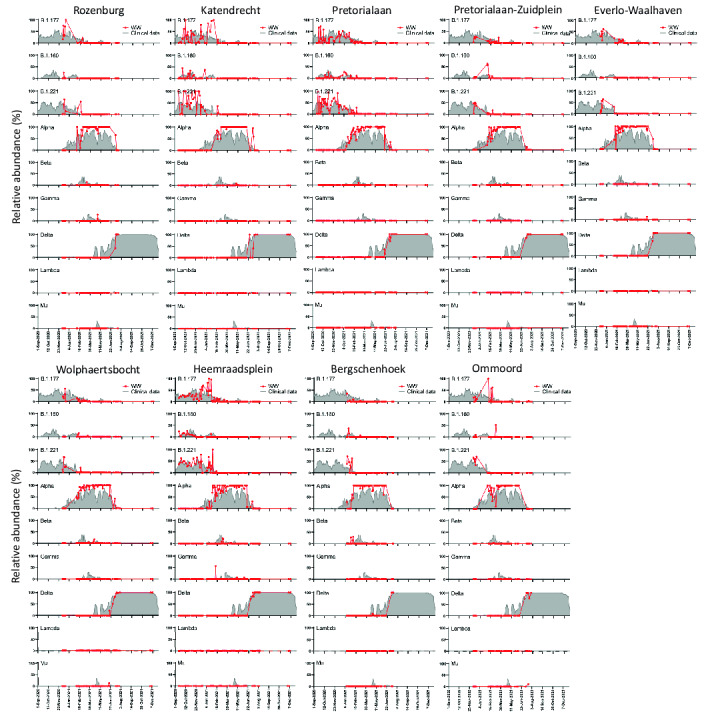
Monitoring of SARS-CoV-2 in wastewater (WW) is a promising tool for epidemiological surveillance, correlating not only viral RNA levels with the infection dynamics within the population, but also to viral diversity. However, the complex mixture of viral lineages in WW samples makes tracking of specific variants or lineages circulating in the population a challenging task. We sequenced sewage samples of 9 WW-catchment areas within the city of Rotterdam, used specific signature mutations from individual SARS-CoV-2 lineages to estimate their relative abundances in WW and compared them against those observed in clinical genomic surveillance of infected individuals between September 2020 and December 2021. We showed that especially for dominant lineages, the median of the frequencies of signature mutations coincides with the occurrence of those lineages in Rotterdam's clinical genomic surveillance. This, along with digital droplet RT-PCR targeting signature mutations of specific variants of concern (VOCs), showed that several VOCs emerged, became dominant and were replaced by the next VOC in Rotterdam at different time points during the study. In addition, single nucleotide variant (SNV) analysis provided evidence that spatio-temporal clusters can also be discerned from WW samples. We were able to detect specific SNVs in sewage, including one resulting in the Q183H amino acid change in the Spike gene, that was not captured by clinical genomic surveillance. Our results highlight the potential use of WW samples for genomic surveillance, increasing the set of epidemiological tools to monitor SARS-CoV-2 diversity.
Keywords: Next generation sequencing; RT-ddPCR; SARS-CoV-2; Single nucleotide variant; Viral diversity; Wastewater genomic surveillance.
Copyright © 2023. Published by Elsevier B.V.
Conflict of interest statement
Declaration of competing interest All the authors declare no competing interests. The funders had no role in the design of the study; in the collection, analyses, or interpretation of data; in the writing of the manuscript, or in the decision to publish the results.
Figures
Similar articles
-
Genomic surveillance of Canadian airport wastewater samples allows early detection of emerging SARS-CoV-2 lineages.Sci Rep. 2024 Nov 3;14(1):26534. doi: 10.1038/s41598-024-76925-6. Sci Rep. 2024. PMID: 39489759 Free PMC article.
-
Long-term monitoring of SARS-CoV-2 variants in wastewater using a coordinated workflow of droplet digital PCR and nanopore sequencing.Water Res. 2024 May 1;254:121338. doi: 10.1016/j.watres.2024.121338. Epub 2024 Feb 18. Water Res. 2024. PMID: 38430753
-
Molecular epidemiology of SARS-CoV-2 in Northern South Africa: wastewater surveillance from January 2021 to May 2022.Front Public Health. 2023 Dec 19;11:1309869. doi: 10.3389/fpubh.2023.1309869. eCollection 2023. Front Public Health. 2023. PMID: 38174083 Free PMC article.
-
Genomic surveillance reveals early detection and transition of delta to omicron lineages of SARS-CoV-2 variants in wastewater treatment plants of Pune, India.Environ Sci Pollut Res Int. 2023 Dec;30(56):118976-118988. doi: 10.1007/s11356-023-30709-z. Epub 2023 Nov 3. Environ Sci Pollut Res Int. 2023. PMID: 37922087
-
Wastewater surveillance of SARS-CoV-2 in Bangladesh: Opportunities and challenges.Curr Opin Environ Sci Health. 2022 Jun;27:100334. doi: 10.1016/j.coesh.2022.100334. Epub 2022 Feb 18. Curr Opin Environ Sci Health. 2022. PMID: 35434440 Free PMC article. Review.
Cited by
-
Advancing Pathogen Identification: The Role of Digital PCR in Enhancing Diagnostic Power in Different Settings.Diagnostics (Basel). 2024 Jul 25;14(15):1598. doi: 10.3390/diagnostics14151598. Diagnostics (Basel). 2024. PMID: 39125474 Free PMC article. Review.
-
Drawing on the Development Experiences of Infectious Disease Surveillance Systems Around the World.China CDC Wkly. 2024 Oct 11;6(41):1065-1074. doi: 10.46234/ccdcw2024.220. China CDC Wkly. 2024. PMID: 39502398 Free PMC article.
-
Agile, on-demand wastewater surveillance of virus infections to support pandemic and outbreak response in Rotterdam-Rijnmond, the Netherlands, 2020 to 2022.Euro Surveill. 2024 Nov;29(47):2400055. doi: 10.2807/1560-7917.ES.2024.29.47.2400055. Euro Surveill. 2024. PMID: 39574391 Free PMC article.
-
Coupling wastewater-based epidemiological surveillance and modelling of SARS-COV-2/COVID-19: Practical applications at the Public Health Agency of Canada.Can Commun Dis Rep. 2023 May 1;49(5):166-174. doi: 10.14745/ccdr.v49i05a01. eCollection 2023 May 1. Can Commun Dis Rep. 2023. PMID: 38404704 Free PMC article.
References
-
- Afgan E., Baker D., Batut B., van den Beek M., Bouvier D., Cech M., Chilton J., Clements D., Coraor N., Grüning B.A., Guerler A., Hillman-Jackson J., Hiltemann S., Jalili V., Rasche H., Soranzo N., Goecks J., Taylor J., Nekrutenko A., Blankenberg D. The galaxy platform for accessible, reproducible and collaborative biomedical analyses: 2018 update. Nucleic Acids Res. 2018;46(W1):W537–W544. doi: 10.1093/nar/gky379. - DOI - PMC - PubMed
-
- Centraal Bureau voor de Statistiek StatLine. 2021. https://opendata.cbs.nl/#/CBS/en/ November 6.
-
- Chang M.R., Ke H., Coherd C.D., Wang Y., Mashima K., Kastrunes G.M., Huang C.-Y., Marasco W.A. Analysis of a SARS-CoV-2 convalescent cohort identified a common strategy for escape of vaccine-induced anti-RBD antibodies by Beta and Omicron variants. EBioMedicine. 2022;80 doi: 10.1016/j.ebiom.2022.104025. - DOI - PMC - PubMed
-
- Choi B., Choudhary M.C., Regan J., Sparks J.A., Padera R.F., Qiu X., Solomon I.H., Kuo H.-H., Boucau J., Bowman K., Adhikari U.D., Winkler M.L., Mueller A.A., Hsu T.Y.-T., Desjardins M., Baden L.R., Chan B.T., Walker B.D., Lichterfeld M., Li J.Z.… Persistence and evolution of SARS-CoV-2 in an immunocompromised host. N. Engl. J. Med. 2020;383(23):2291–2293. doi: 10.1056/NEJMc2031364. - DOI - PMC - PubMed
MeSH terms
Substances
Supplementary concepts
LinkOut - more resources
Full Text Sources
Medical
Miscellaneous
