Rhinovirus C causes heterogeneous infection and gene expression in airway epithelial cell subsets
- PMID: 36796588
- PMCID: PMC10629931
- DOI: 10.1016/j.mucimm.2023.01.008
Rhinovirus C causes heterogeneous infection and gene expression in airway epithelial cell subsets
Abstract
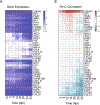
Rhinoviruses infect ciliated airway epithelial cells, and rhinoviruses' nonstructural proteins quickly inhibit and divert cellular processes for viral replication. However, the epithelium can mount a robust innate antiviral immune response. Therefore, we hypothesized that uninfected cells contribute significantly to the antiviral immune response in the airway epithelium. Using single-cell RNA sequencing, we demonstrate that both infected and uninfected cells upregulate antiviral genes (e.g. MX1, IFIT2, IFIH1, and OAS3) with nearly identical kinetics, whereas uninfected non-ciliated cells are the primary source of proinflammatory chemokines. Furthermore, we identified a subset of highly infectable ciliated epithelial cells with minimal interferon responses and determined that interferon responses originate from distinct subsets of ciliated cells with moderate viral replication. These findings suggest that the composition of ciliated airway epithelial cells and coordinated responses of infected and uninfected cells could determine the risk of more severe viral respiratory illnesses in children with asthma, chronic obstructive pulmonary disease, and genetically susceptible individuals.
Copyright © 2023 The Authors. Published by Elsevier Inc. All rights reserved.
Conflict of interest statement
DECLARATIONS OF COMPETING INTERESTS
The authors have no competing interests to declare.
Figures



Similar articles
-
Airway Epithelial Cell Immunity Is Delayed During Rhinovirus Infection in Asthma and COPD.Front Immunol. 2020 May 15;11:974. doi: 10.3389/fimmu.2020.00974. eCollection 2020. Front Immunol. 2020. PMID: 32499788 Free PMC article.
-
Rhinovirus infection of the airway epithelium enhances mast cell immune responses via epithelial-derived interferons.J Allergy Clin Immunol. 2023 Jun;151(6):1484-1493. doi: 10.1016/j.jaci.2022.12.825. Epub 2023 Jan 26. J Allergy Clin Immunol. 2023. PMID: 36708815 Free PMC article.
-
Impaired type I and type III interferon induction and rhinovirus control in human cystic fibrosis airway epithelial cells.Thorax. 2012 Jun;67(6):517-25. doi: 10.1136/thoraxjnl-2011-200405. Epub 2012 Jan 2. Thorax. 2012. Retraction in: Thorax. 2013 Sep;68(9):886. doi: 10.1136/thoraxjnl-2011-200405ret PMID: 22213737 Retracted.
-
Rhinovirus and Innate Immune Function of Airway Epithelium.Front Cell Infect Microbiol. 2020 Jun 19;10:277. doi: 10.3389/fcimb.2020.00277. eCollection 2020. Front Cell Infect Microbiol. 2020. PMID: 32637363 Free PMC article. Review.
-
Regulation and Function of Interferon-Lambda (IFNλ) and Its Receptor in Asthma.Front Immunol. 2021 Nov 10;12:731807. doi: 10.3389/fimmu.2021.731807. eCollection 2021. Front Immunol. 2021. PMID: 34899691 Free PMC article. Review.
Cited by
-
Farm animal exposure, respiratory illnesses, and nasal cell gene expression.J Allergy Clin Immunol. 2024 Jun;153(6):1647-1654. doi: 10.1016/j.jaci.2024.01.019. Epub 2024 Feb 2. J Allergy Clin Immunol. 2024. PMID: 38309597
-
Diverging patterns in innate immunity against respiratory viruses during a lifetime: lessons from the young and the old.Eur Respir Rev. 2024 Jun 12;33(172):230266. doi: 10.1183/16000617.0266-2023. Print 2024 Apr. Eur Respir Rev. 2024. PMID: 39009407 Free PMC article. Review.
-
Human Stimulator of Interferon Genes Promotes Rhinovirus C Replication in Mouse Cells In Vitro and In Vivo.Viruses. 2024 Aug 10;16(8):1282. doi: 10.3390/v16081282. Viruses. 2024. PMID: 39205256 Free PMC article.
-
High frequencies of nonviral colds and respiratory bacteria colonization among children in rural Western Uganda.Front Pediatr. 2024 May 2;12:1379131. doi: 10.3389/fped.2024.1379131. eCollection 2024. Front Pediatr. 2024. PMID: 38756971 Free PMC article.
-
Rhinovirus infection of airway epithelial cells uncovers the non-ciliated subset as a likely driver of genetic risk to childhood-onset asthma.Cell Genom. 2024 Sep 11;4(9):100636. doi: 10.1016/j.xgen.2024.100636. Epub 2024 Aug 27. Cell Genom. 2024. PMID: 39197446 Free PMC article.
References
-
- Kieninger E. et al. High rhinovirus burden in lower airways of children with cystic fibrosis. Chest 143, 782–790 (2013). - PubMed
Publication types
MeSH terms
Substances
Supplementary concepts
Grants and funding
LinkOut - more resources
Full Text Sources

