

Small hand-designed convolutional neural networks outperform transfer learning in automated cell shape detection in confluent tissues
- PMID: 36795738
- PMCID: PMC9934364
- DOI: 10.1371/journal.pone.0281931
Small hand-designed convolutional neural networks outperform transfer learning in automated cell shape detection in confluent tissues
Abstract
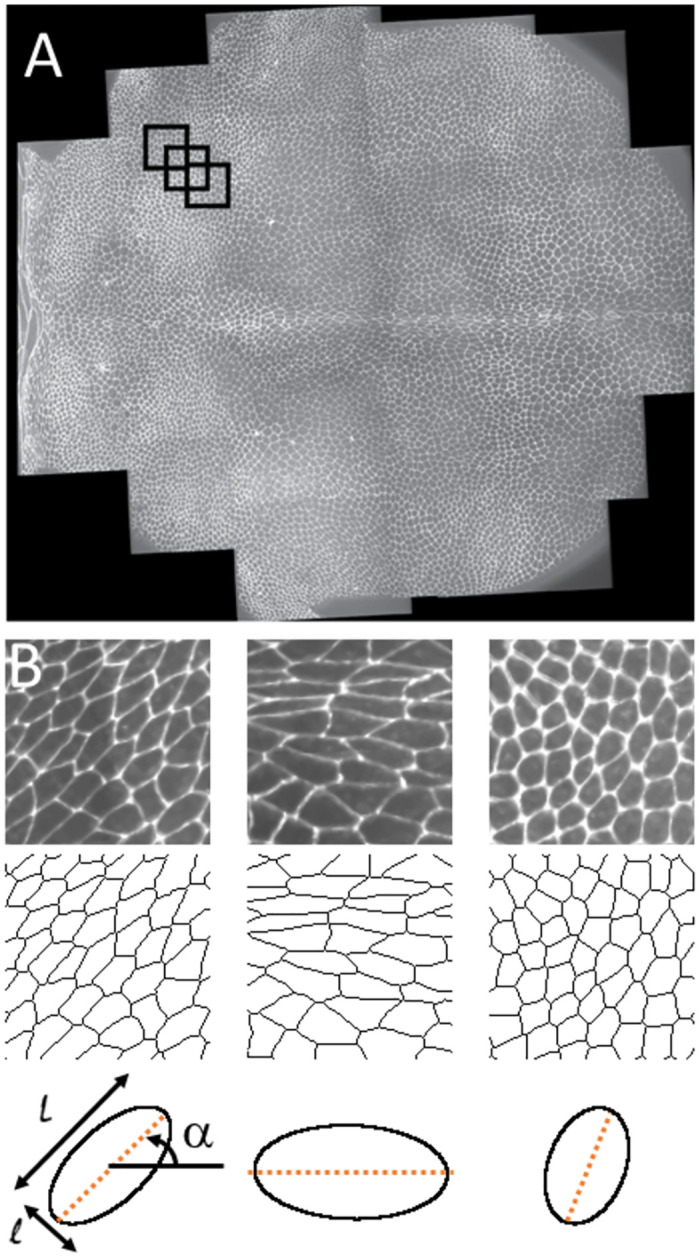
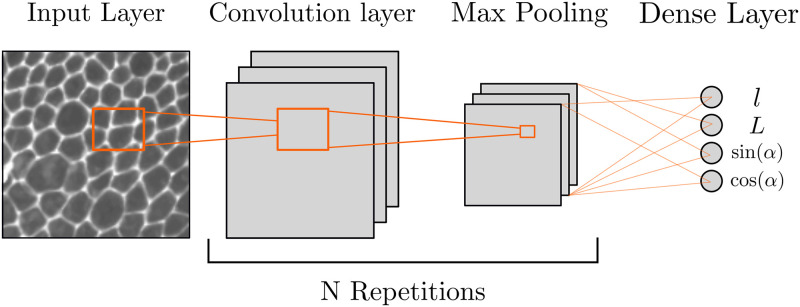
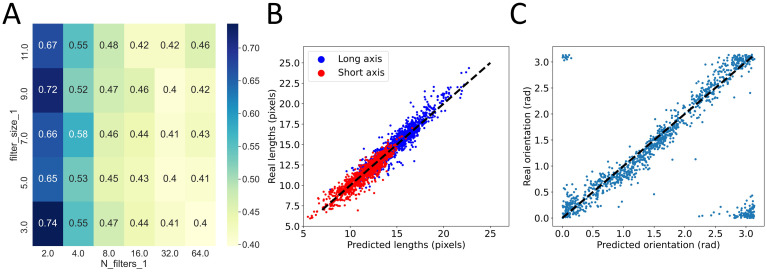
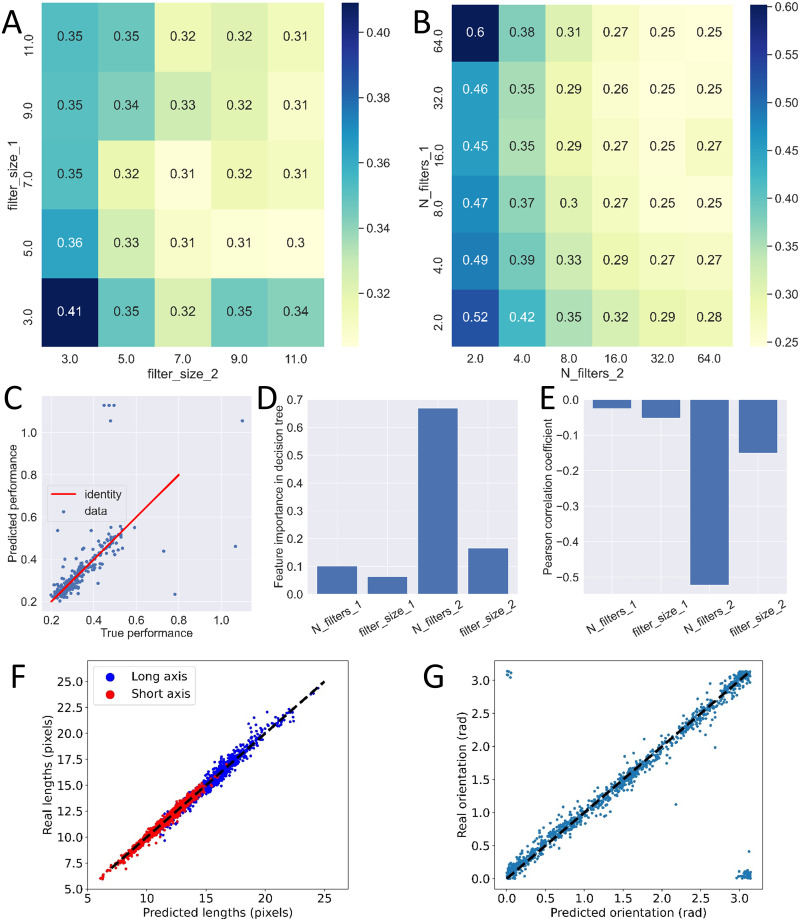
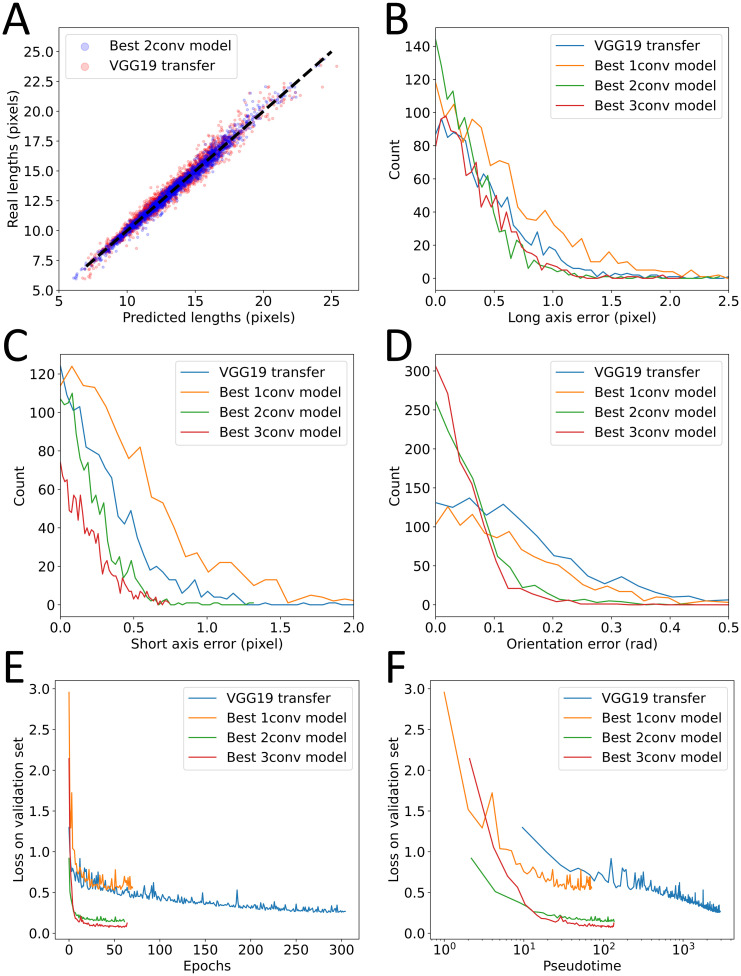
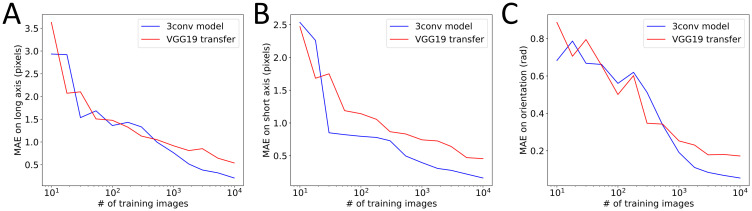
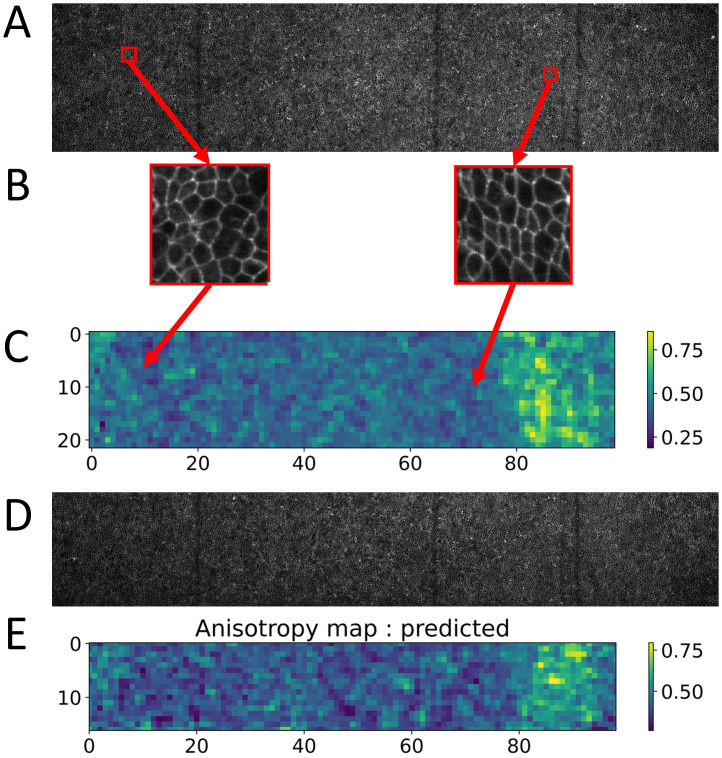
Mechanical cues such as stresses and strains are now recognized as essential regulators in many biological processes like cell division, gene expression or morphogenesis. Studying the interplay between these mechanical cues and biological responses requires experimental tools to measure these cues. In the context of large scale tissues, this can be achieved by segmenting individual cells to extract their shapes and deformations which in turn inform on their mechanical environment. Historically, this has been done by segmentation methods which are well known to be time consuming and error prone. In this context however, one doesn't necessarily require a cell-level description and a coarse-grained approach can be more efficient while using tools different from segmentation. The advent of machine learning and deep neural networks has revolutionized the field of image analysis in recent years, including in biomedical research. With the democratization of these techniques, more and more researchers are trying to apply them to their own biological systems. In this paper, we tackle a problem of cell shape measurement thanks to a large annotated dataset. We develop simple Convolutional Neural Networks (CNNs) which we thoroughly optimize in terms of architecture and complexity to question construction rules usually applied. We find that increasing the complexity of the networks rapidly no longer yields improvements in performance and that the number of kernels in each convolutional layer is the most important parameter to achieve good results. In addition, we compare our step-by-step approach with transfer learning and find that our simple, optimized CNNs give better predictions, are faster in training and analysis and don't require more technical knowledge to be implemented. Overall, we offer a roadmap to develop optimized models and argue that we should limit the complexity of such models. We conclude by illustrating this strategy on a similar problem and dataset.
Copyright: © 2023 Combe et al. This is an open access article distributed under the terms of the Creative Commons Attribution License, which permits unrestricted use, distribution, and reproduction in any medium, provided the original author and source are credited.
Conflict of interest statement
The authors have declared that no competing interests exist.
Figures

Similar articles
-
MABAL: a Novel Deep-Learning Architecture for Machine-Assisted Bone Age Labeling.J Digit Imaging. 2018 Aug;31(4):513-519. doi: 10.1007/s10278-018-0053-3. J Digit Imaging. 2018. PMID: 29404850 Free PMC article.
-
Segmenting brain tumors from FLAIR MRI using fully convolutional neural networks.Comput Methods Programs Biomed. 2019 Jul;176:135-148. doi: 10.1016/j.cmpb.2019.05.006. Epub 2019 May 11. Comput Methods Programs Biomed. 2019. PMID: 31200901
-
Semi-supervised learning for automatic segmentation of the knee from MRI with convolutional neural networks.Comput Methods Programs Biomed. 2020 Jun;189:105328. doi: 10.1016/j.cmpb.2020.105328. Epub 2020 Jan 11. Comput Methods Programs Biomed. 2020. PMID: 31958580
-
Machine learning techniques for biomedical image segmentation: An overview of technical aspects and introduction to state-of-art applications.Med Phys. 2020 Jun;47(5):e148-e167. doi: 10.1002/mp.13649. Med Phys. 2020. PMID: 32418337 Free PMC article. Review.
-
Uncovering Ecological Patterns with Convolutional Neural Networks.Trends Ecol Evol. 2019 Aug;34(8):734-745. doi: 10.1016/j.tree.2019.03.006. Epub 2019 May 8. Trends Ecol Evol. 2019. PMID: 31078331 Review.
Cited by
-
Accelerating computer vision-based human identification through the integration of deep learning-based age estimation from 2 to 89 years.Sci Rep. 2024 Feb 20;14(1):4195. doi: 10.1038/s41598-024-54877-1. Sci Rep. 2024. PMID: 38379027 Free PMC article.
References
Publication types
MeSH terms
Grants and funding
LinkOut - more resources
Full Text Sources
