. 2023 Feb 14;8(1):17.
doi: 10.1038/s41541-023-00607-z.

QuilA® adjuvanted Coxevac® sustains Th1-CD8+-type immunity and increases protection in Coxiella burnetii-challenged goats

Affiliations

QuilA® adjuvanted Coxevac® sustains Th1-CD8+-type immunity and increases protection in Coxiella burnetii-challenged goats

Sara Tomaiuolo et al. NPJ Vaccines. .

Abstract

Coxevac® is the EMA-approved veterinary vaccine for the protection of cattle and goats against Q fever, a zoonotic bacterial disease due to Coxiella burnetii. Since Coxevac® reduces bacterial shedding and clinical symptoms but does not prevent infection, novel, ready-to-use vaccine formulations are needed to increase its immunogenicity. Here, a goat vaccination-challenge model was used to evaluate the impact of the commercially available saponin-based QuilA® adjuvant on Coxevac® immunity. Upon challenge, the QuilA®-Coxevac® group showed a stronger immune response reflected in a higher magnitude of total IgG and an increase in circulating and splenic CD8+ T-cells compared to the Coxevac® and challenged-control groups. The QuilA®-Coxevac® group was characterized by a targeted Th1-type response (IFNγ, IP10) associated with increased transcripts of CD8+ and NK cells in spleens and γδ T cells in bronchial lymph nodes. Coxevac® vaccinated animals presented an intermediate expression of Th1-related genes, while the challenged-control group showed an immune response characterized by pro-inflammatory (IL1β, TNFα, IL12), Th2 (IL4 and IL13), Th17 (IL17A) and other immunoregulatory cytokines (IL6, IL10). An intriguing role was observed for γδ T cells, which were of TBX21- and SOX4-types in the QuilA®-Coxevac® and challenged control group, respectively. Overall, the addition of QuilA® resulted in a sustained Th1-type activation associated with an increased vaccine-induced bacterial clearance of 33.3% as compared to Coxevac® only. QuilA® could be proposed as a readily-applied veterinary solution to improve Coxevac® efficacy against C. burnetii infection in field settings.


Conflict of interest statement

The authors declare no competing interests.

Figures
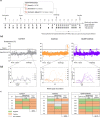
Fig. 1
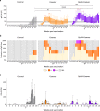
Fig. 1. Overview of the experimental design, daily temperature and bacterial burden of the vaccination-challenge experiment in goats.
a A prime–boost strategy was used for the vaccination of goats with Coxevac® (n = 6) or QuilA-Coxevac® (n = 6). As controls, goats (n = 4) were similarly injected with PBS. At week 13 post vaccination, all groups were intranasally challenged with the C. burnetii CbBEC2 strain. At the indicated time points, serum was collected to evaluate the specific antibody response, PBMCs (peripheral blood mononuclear cells) were isolated for T and B cell phenotyping and the interferonγ (IFNγ) production was detected in antigen stimulated PBMCs. At sacrifice, organs were collected for bacterial detection, cell phenotyping and gene expression profiling. b QuilA®-Coxevac® prime vaccination induces a transient increase in the rectal temperature. b1 Daily monitoring of rectal temperature upon vaccination and challenge for the control, Coxevac® and QuilA®-Coxevac® groups. b2 Zoom on selected time points for each group to display specific patterns of goats. Individual daily values are represented for all animals (b1,2). c C. burnetii detection by PCR assay in splenocytes and bronchial lymph node cells isolated at sacrifice. Samples were injected in embryonated eggs (in triplicates) for bacterial amplification and only yolk sacs of eggs dying after day 5 post injection were collected. V2 splenocytes and V2 and V3 respiratory lymph node cells were highly contaminated and amplification in eggs was not possible. Goats presenting at least one positive result per organ were considered to be positive. W = week after vaccination, C = control goat, V = vaccinated goat (Coxevac®), VA = vaccinated plus adjuvant goat (QuilA®-Coxevac®).
Fig. 2
Fig. 2. Kinetics of antigen specific-IgG and IFNɣ production upon vaccination and challenge infection.
a QuilA®-Coxevac® vaccination induced robust and sustained C. burnetii-specific serum IgG titers compared to the Control and Coxevac® group. Boxplots represent IgG titers calculated as the percentage of sample/positive (S/P%) ratio for each sample. S/P% > 40 was considered as positive (values above the black line). The antibody response was analyzed after vaccination with a multiple unpaired T test with Welch correction followed by a two-stage linear step-up method of Benjamini, Krieger and Yekutieli to correct for multiple comparisons by False Discovery Rate (FDR) (red asterisks, *FDR ≤ 0.01). After challenge, differences between the three groups were assessed using the Kruskal–Wallis test with Dunn’s multiple comparison post hoc test (black asterisks, **p ≤ 0.01; ****p ≤ 0.0001). Boxplots are extended from the 25th to 75th percentiles, with a line at the median, and whiskers go from minima to maxima. b Frequency of anti-C. burnetii IgG titers for the control, Coxevac® and QuilA®-Coxevac® group. Neg = Titers ≤40; + = 40 < titers ≤ 100; ++ = 100 < titers ≤ 200; +++ = 200 < titers ≤ 300. c Differential IFNγ secretion by PBMCs stimulated with inactivated whole-cell C. burnetii. The IFNγ response was analyzed after challenge using mixed-effects models with Geisser–Greenhouse correction (data presented in the result section). Data are represented as mean ± SD. IFNγ secretion trends (in black) were visualized via interpolation of cubic splines. ↑ = moment of challenge.
Fig. 3
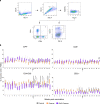
Fig. 3. The two Coxevac® formulations activate cell subsets of different nature upon challenge.
a Gating strategy used in the analysis of T and B lymphocytes in ex vivo stained PMBCs. Cellular subtypes were identified based on the expression of CD4, CD8 and CD21 cell markers. Plots are from a representative animal. Cell frequencies were calculated as percent of the viable cell population. b Kinetics of CD4+, CD8+, CD4CD8 and CD21+ cell frequencies in PBMCs upon vaccination and challenge. Each kinetic was analyzed using the mixed-effects models, both after vaccination and challenge, with Geisser–Greenhouse correction followed by Tukey’s multiple comparison post-hoc test (*p ≤ 0.05). Data are represented as boxplots extended from the 25th to 75th percentiles, with a line at the median, and whiskers go from minima to maxima. w = week after vaccination. ↑ = moment of challenge.
Fig. 4
Fig. 4. Higher frequencies of CD8+ cells and granulocytes detected in the spleen of the QuilA®-Coxevac® group at sacrifice.
a Frequencies of CD4+, CD8+, CD4CD8 and CD21+ cells present in the spleen of control, Coxevac® and QuilA®-Coxevac® goats. The gating strategy is shown in Fig. 5a. b Gating strategy used in the analysis of granulocytes observed in goat spleens and quantification of their frequency. The granulocyte population was identified based on size and granularity characteristics. Group comparisons were performed using one-way ANOVA test with Tukey’s multiple comparison post-hoc test (*p ≤ 0.05; **p ≤ 0.01) (a, b). Cell frequencies were calculated as percent of the viable cell population and data are represented as boxplots extended from the 25th to 75th percentiles, with a line at the median, and whiskers go from minima to maxima (a, b).
Fig. 5
Fig. 5. Distinctive transcriptional patterns are induced in spleens of vaccinated and control animals upon challenge.
a Expression profiles of selected genes (n = 23) in control, Coxevac® and QuilA®-Coxevac® groups at sacrifice. Data are represented as scatter dot plots with a line at the geometric mean. Outliers are identified and removed using the ROUT method (Q = 1%). Differences between experimental groups were tested using the one-way ANOVA test with Tukey’s multiple comparison post hoc test or the Kruskal–Wallis test with Dunn’s multiple comparison post hoc test depending on the results of the homogeneity of variance and normality of residuals evaluated via the Bartlett’s and Shapiro–Wilk tests, respectively (*p ≤ 0.05; **p ≤ 0.01). b Hierarchical clustering heatmap analysis of data issued from the gene expression profiling in the spleen. Each colored cell on the map corresponds to the value of the geometric mean for each group. Values are measured by maximum distance with a Ward.2 clustering algorithm.
Fig. 6
Fig. 6. Distinctive transcriptional patterns are induced in bronchial lymph nodes of vaccinated and control animals upon challenge.
a Expression profiles of selected genes in control, Coxevac® and QuilA®-Coxevac® groups at sacrifice. Data are represented as scatter dot plots with a line at the geometric mean. Outliers are identified and removed using the ROUT method (Q = 1%). Differences between experimental groups were tested using the one-way ANOVA test with Tukey’s multiple comparison post hoc test or the Kruskal–Wallis test with Dunn’s multiple comparison post hoc test depending on the results of the homogeneity of variance and normality of residuals evaluated via the Bartlett’s and Shapiro–Wilk tests, respectively (*p ≤ 0.05; **p ≤ 0.01; ****p ≤ 0.0001). b Hierarchical clustering heatmap analysis of data issued from the gene expression profiling in respiratory lymph nodes. Each colored cell on the map corresponds to the value of the geometric mean for each group. Values are measured by maximum distance with a Ward.2 clustering algorithm.
Fig. 7
Fig. 7. Specific immune responses distinguish Coxevac®, QuilA®-Coxevac® and control goats following C. burnetii challenge.
a Principal component analysis (PCA) of the complete dataset (n = 68), which included data from serology (weeks 13.5, 17.5 and 19 pv), IFNγ secretion upon antigen specific stimulated PBMCs (weeks 13.5, 17.5 and 19 pv), organ and blood (week 19 pv) phenotyping and gene expression profiles. b PCA of specific selected variables (n = 22) resulting in an accurate separation of the three conditions. From the left, graph 1 is the 2D PCA score plot of the first two components (a, b). Symbols represent animals, the central one corresponds to the mean coordinates of the individuals in the group. Graph 2 is the PCA loading plot showing the distribution of all 22 variables (b) or of variables with a contribution more than 1.5 (n = 31, the loading plot containing all 68 variables is shown in Supplementary Fig. 5) (a). Graph 3 is the 3D PCA score plot of the first three components, realized to increase the proportion of variance illustrated by the analysis (a, b). B=blood, S=spleen, BL=bronchial lymph nodes, IL=inguinal lymph nodes, PH=phenotyping, W=week, Contrib=contribution.

Similar articles

Cited by

References

    1. Oyston PCF, Davies C. Q fever: the neglected biothreat agent. J. Med. Microbiol. 2011;60:9–21. doi: 10.1099/jmm.0.024778-0. - DOI - PubMed
    1. Sanford SE, Josephson GK, MacDonald A. Coxiella burnetii (Q fever) abortion storms in goat herds after attendance at an annual fair. Can. Vet. J. 1994;35:376–378. - PMC - PubMed
    1. Emery MP, et al. Coxiella burnetii serology assays in goat abortion storm. J. Vet. Diagn. Invest. 2014;26:141–145. doi: 10.1177/1040638713517233. - DOI - PubMed
    1. Guatteo R, Beaudeau F, Joly A, Seegers H. Coxiella burnetii shedding by dairy cows. Vet. Res. 2007;38:849–860. doi: 10.1051/vetres:2007038. - DOI - PubMed
    1. Rodolakis A, et al. Comparison of Coxiella burnetii shedding in milk of dairy bovine, caprine, and ovine herds. J. Dairy Sci. 2007;90:5352–5360. doi: 10.3168/jds.2006-815. - DOI - PubMed