. 2023 Mar 15;136(6):jcs260759.
doi: 10.1242/jcs.260759. Epub 2023 Mar 10.

The ecl family gene ecl3+ is induced by phosphate starvation and contributes to sexual differentiation in fission yeast

Affiliations

The ecl family gene ecl3+ is induced by phosphate starvation and contributes to sexual differentiation in fission yeast

Hokuto Ohtsuka et al. J Cell Sci. .

Abstract

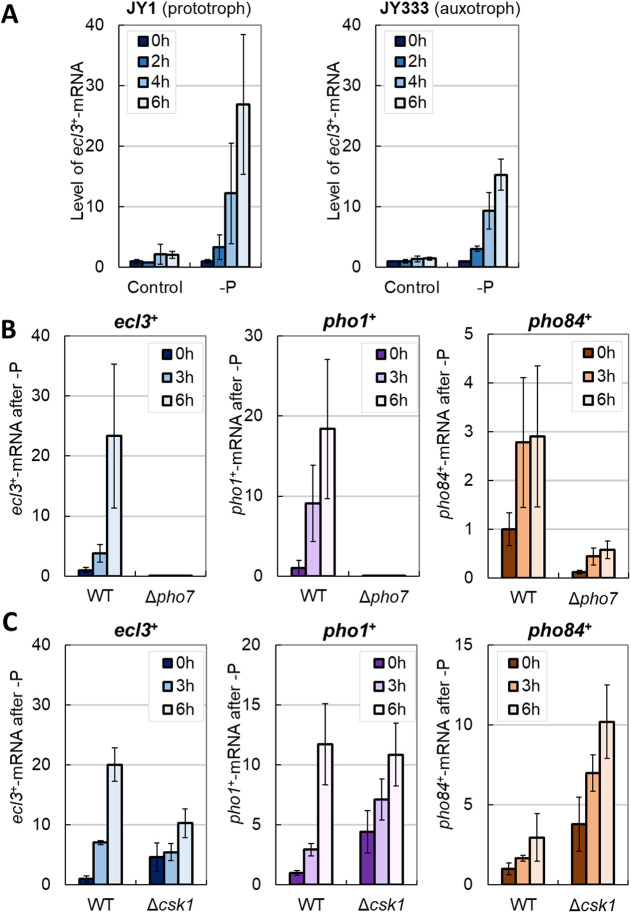
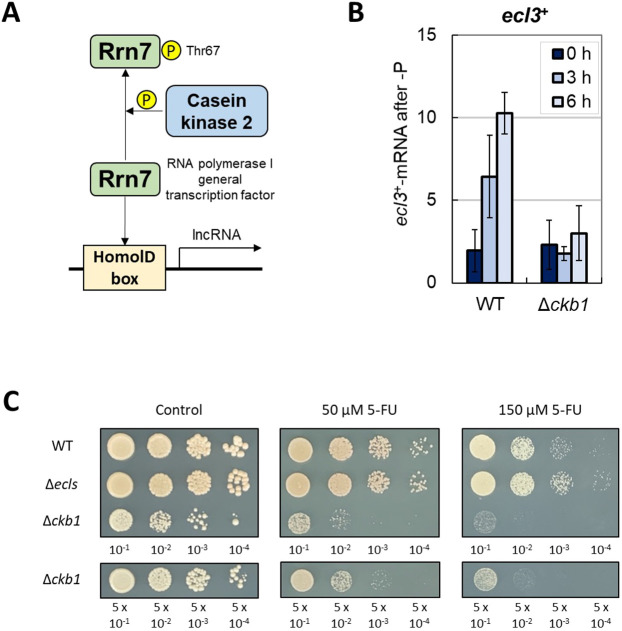
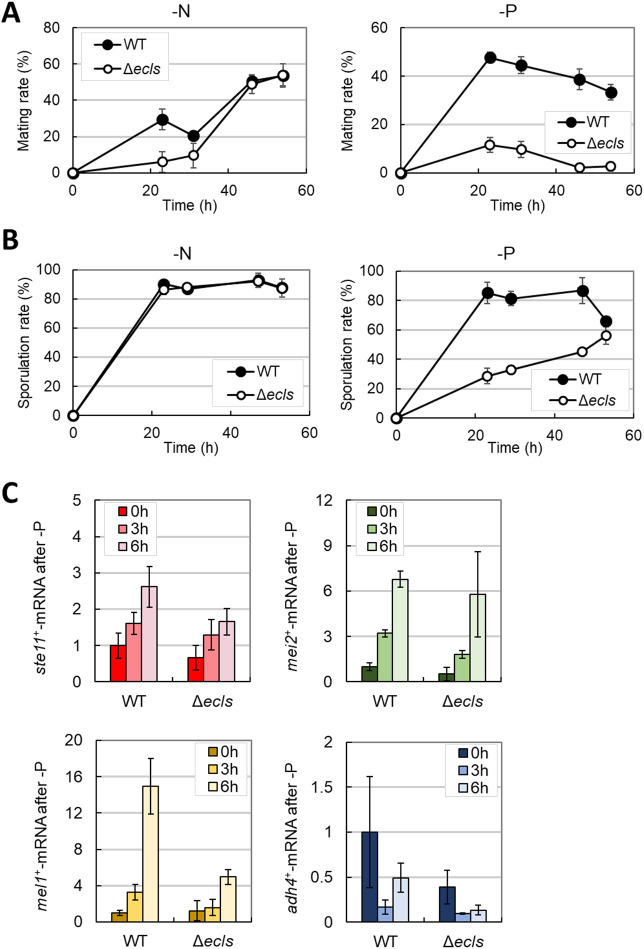
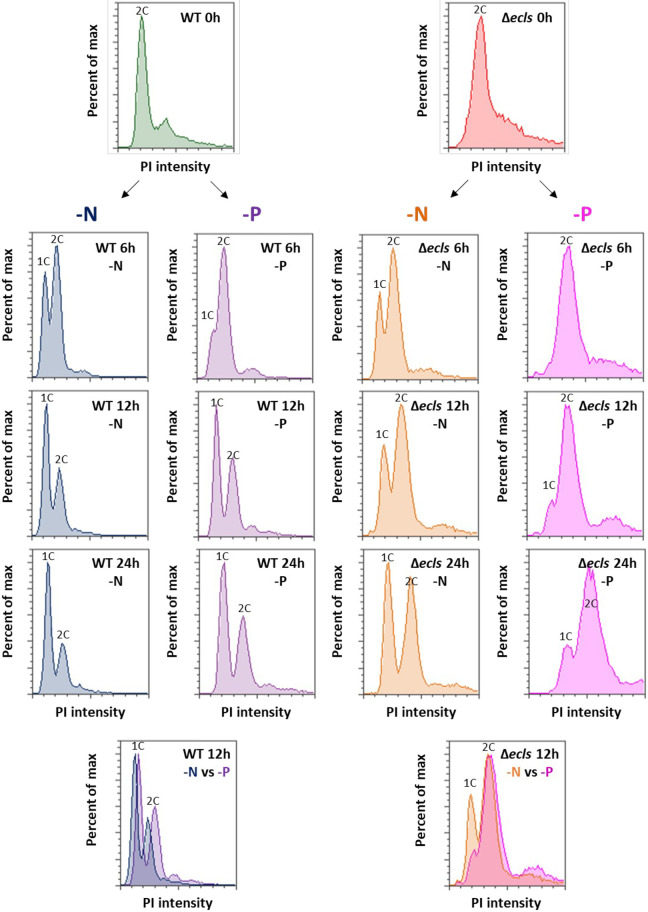
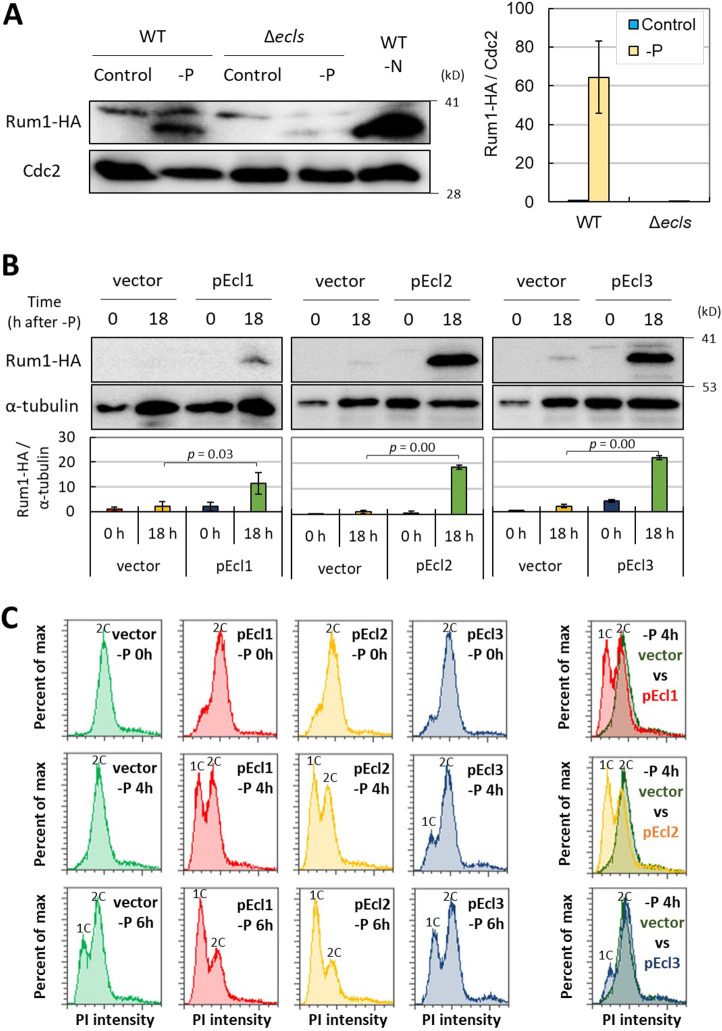
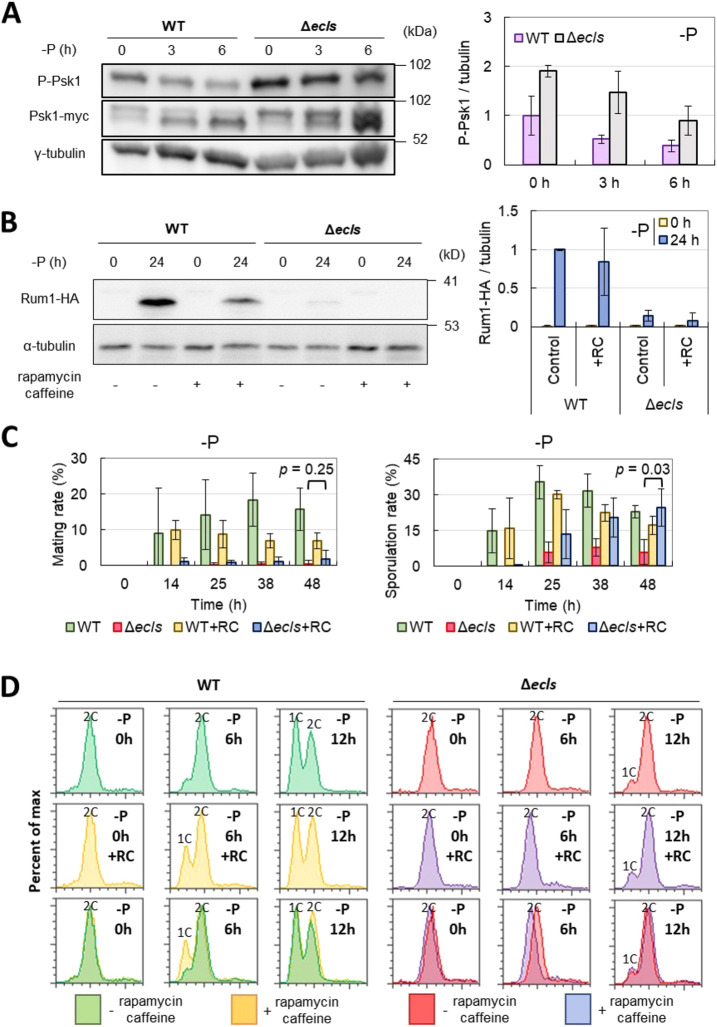
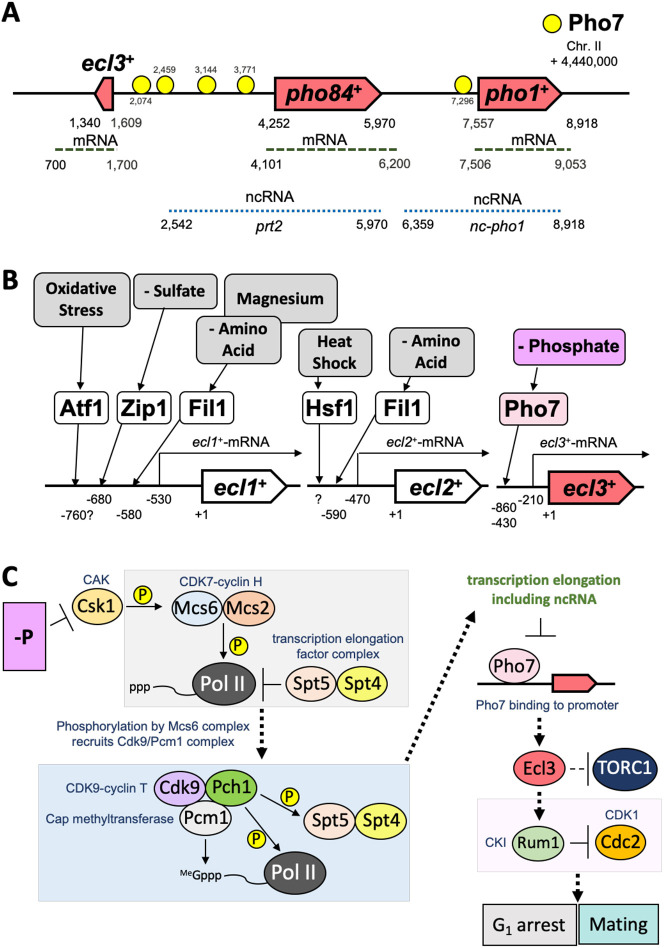
In Schizosaccharomyces pombe, ecl family genes are induced by several signals, such as starvation of various nutrients, including sulfur, amino acids and Mg2+, and environmental stress, including heat or oxidative stress. These genes mediate appropriate cellular responses and contribute to the maintenance of cell viability and induction of sexual differentiation. Although this yeast has three ecl family genes with overlapping functions, any environmental conditions that induce ecl3+ remain unidentified. We demonstrate that ecl3+ is induced by phosphate starvation, similar to its chromosomally neighboring genes, pho1+ and pho84+, which respectively encode an extracellular acid phosphatase and an inorganic phosphate transporter. ecl3+ expression was induced by the transcription factor Pho7 and affected by the cyclin-dependent kinase (CDK)-activating kinase Csk1. Phosphate starvation induced G1 arrest and sexual differentiation via ecl family genes. Biochemical analyses suggested that this G1 arrest was mediated by the stabilization of the CDK inhibitor Rum1, which was dependent on ecl family genes. This study shows that ecl family genes are required for appropriate responses to phosphate starvation and provides novel insights into the diversity and similarity of starvation responses.

Keywords: ecl family genes; Fission yeast; G1 cell cycle arrest; Lifespan; Phosphate signal transduction pathway; Phosphate starvation; Sexual differentiation.


Conflict of interest statement

Competing interests The authors declare no competing or financial interests.

Figures

Fig. 1.
Fig. 1.
Phosphate starvation induces ecl3+ expression in a pho7+-dependent manner. The mRNA levels of ecl3+, pho1+ and pho84+ were measured by real-time PCR. (A) Prototrophic JY1 and auxotrophic JY333 cells were grown in Edinburgh minimal medium (EMM) to OD600=0.5 and then transferred into EMM with (control) and without Na2HPO4 (−P) (n=3). The expression of ecl3+ at 0, 2, 4 and 6 h after phosphate starvation was measured. (B) JY333 (wild-type or WT) and JY333Δpho7pho7) cells were grown in EMM to OD600=0.5 and then transferred into EMM without Na2HPO4 (n=3). The expression of ecl3+, pho1+ and pho84+ at 0, 3 and 6 h after phosphate starvation was measured. (C) JY333 (WT) and JY333Δcsk1csk1) cells were grown in EMM to OD600=0.5 and then transferred into EMM without Na2HPO4 (n=3). The expression of ecl3+, pho1+ and pho84+ at 0, 3 and 6 h after phosphate starvation was measured. For cultures of JY333, JY333Δpho7 and JY333Δcsk1, 40 mg l−1 adenine and 60 mg l−1 leucine were added. Data show the mean±s.d.
Fig. 2.
Fig. 2.
Casein kinase 2 regulates proper ecl3+ induction under phosphate starvation. (A) Simple illustration of the regulation of lncRNA expression via the HomolD box. Phosphorylation of Rrn7 by casein kinase 2 prevents the binding of Rrn7 to the HomolD box. (B) ED668 (WT) and Δckb1 (from the Deletion Mutant Library) cells were grown in EMM to OD600=0.5 and then transferred into EMM without Na2HPO4 (n=3). The mRNA levels of ecl3+ at 0, 3 and 6 h after phosphate starvation were measured by real-time PCR. Data show the mean±s.d. (C) ED668 (WT), ED668Δecl1/2/3 h+ecls) and Δckb1 (from the Deletion Mutant Library) cells were grown in YE to OD600=1.0 and then spotted on YE plates containing 5-fluorouracil (5-FU) with serial dilution (n=2). The Δckb1 cells were spotted with two patterns of dilution because deletion of ckb1+ adversely affects cell growth even under unstressed conditions.
Fig. 3.
Fig. 3.
Ecl1 family genes are required for proper sexual development under phosphate depletion. (A) JY808 (WT) and JY808Δecl1/2/3ecls) cells were grown in EMM to OD600=0.5 and then transferred into nitrogen (−N) and phosphate (−P)-depleted EMM. Each mating rate was measured (n=3). (B) The diploid cells (JY333×HM3802) (WT) and JY333Δecl1/2/3×HM3802Δecl1/2/3ecls) were grown in EMM to OD600=0.5 and then transferred into nitrogen- and phosphate-depleted EMM. Each sporulation rate was measured (n=3). (C) JY333 (WT) and JY333Δecl1/2/3ecls) cells were grown in EMM to OD600=0.5 and then transferred into EMM without Na2HPO4 (n=3). The mRNA levels of ste11+, mei2+, mel1+ and adh4+ at 0, 3 and 6 h after phosphate starvation were measured using real-time PCR. Data show the mean±s.d.
Fig. 4.
Fig. 4.
ecl family genes are required for proper G1 arrest under phosphate depletion. JY333 (WT) and JY333Δecl1/2/3ecls) cells were grown in EMM to OD600=0.5 and then transferred into nitrogen- or phosphate-depleted EMM. DNA content was measured by flow cytometry. The merged results of 12 h after starvation are also shown in the bottom panels. All graphs show PI intensities from 0 to 100,000.
Fig. 5.
Fig. 5.
ecl family genes promote G1 arrest by stabilizing Rum1. (A) WT (FY7288) and Δecls (FY7288Δecl1/2/3) cells were grown in EMM to OD600=0.5 (control) and then transferred into nitrogen-depleted (−N) or phosphate-depleted (−P) EMM for 24 h. The level of Rum1–HA was measured using western blot assay. Of the two bands detected by the anti-HA antibody, the upper band is expected to be phosphorylated (Benito et al., 1998; Matsuoka et al., 2002). The intensity of the Rum1–HA lower band was measured and normalized to the intensity of the Cdc2 band (Rum1–HA/Cdc2) (right panel) (n=3). (B) JY333 Rum1HA h90 cells carrying pREP1 (vector), pREP1-Ecl1 (pEcl1), pREP1-Ecl2 (pEcl2) and pREP1-Ecl3 (pEcl3) were grown in EMM to OD600=0.5 and then transferred into phosphate-depleted (−P) EMM for 18 h. The level of Rum1–HA was measured using western blot assay. The quantitative results are shown in the lower panels (n=3). (C) JY333 Rum1HA h90 cells carrying pREP1 (vector), pREP1-Ecl1 (pEcl1), pREP1-Ecl2 (pEcl2) and pREP1-Ecl3 (pEcl3) were grown in EMM to OD600=0.5 and then transferred into phosphate-depleted (−P) EMM. DNA content was measured via flow cytometry. The merged results of 4 h after starvation are shown in the right panels. All graphs show PI intensities from 0 to 50,000. Data show the mean±s.d.
Fig. 6.
Fig. 6.
Some phenotypes of Δecls cells were not restored by TORC1 suppression. (A) JS183 (WT) and JS184 (Δecls) cells were grown in EMM to OD600=0.5 and then transferred into phosphate-depleted EMM. Phosphorylation levels of Psk1 at 0, 3 and 6 h after phosphate starvation (−P) were examined using western blotting (left). Quantitative results of phosphorylation levels (P-Psk1/γ-tubulin) are shown in the right panel (n=3). (B) WT (FY7288) and Δecls (FY7288Δecl1/2/3) were grown in EMM to OD600=0.5 (control) and then transferred into phosphate-depleted (−P) EMM (24 h) with and without 200 ng ml−1 rapamycin and 9 mM caffeine (RC). Rum1–HA levels were measured using western blotting (left). Quantitative results are shown in the right panel (n=3). (C) Left panel: JY808 (WT) and JY808Δecl1/2/3ecls) cells were grown in EMM to OD600=0.5 and then transferred into phosphate-depleted EMM with and without 200 ng ml−1 rapamycin and 9 mM caffeine (RC). Each mating rate was measured (n=3). Right panel: the diploid cells (JY333×HM3802) (WT) and JY333Δecl1/2/3×HM3802Δecl1/2/3ecls) were grown in EMM to OD600=0.5 and then transferred into phosphate-depleted EMM with and without 200 ng ml−1 rapamycin and 9 mM caffeine (RC). Each sporulation rate was measured (n=3). (D) JY333 (WT) and JY333Δecl1/2/3ecls) cells were grown in EMM to OD600=0.5 and then transferred into phosphate-depleted (−P) EMM with and without 200 ng ml−1 rapamycin and 9 mM caffeine. DNA content was measured by flow cytometry. All graphs show PI intensities from 0 to 50,000. Data show the mean±s.d.
Fig. 7.
Fig. 7.
Schematics for induction of ecl family genes. (A) The chromosomal region from 4,440,000 to 4,450,000 of chromosome II containing ecl3+ in S. pombe. The binding sites of Pho7 are illustrated based on a previous study (Carter-O'Connell et al., 2012). ncRNA, noncoding RNA. (B) Signals and the transcription factors that induce ecl family genes. (C) Phosphate starvation induced sexual differentiation via the induction of Ecl family proteins. S. pombe has two partially redundant CDK-activating kinases (CAKs), namely, the CDK7–cyclin H (Mcs6–Mcs2 in S. pombe) complex and Csk1 (Hermand et al., 1998; Lee et al., 1999; Gerber et al., 2008). Under phosphate-rich conditions, the expression of PHO genes including pho1+ is suppressed through an active process involving Csk1, the positive transcription elongation factor b (P-TEFb) subunit Cdk9, and the phosphorylation of the carboxyl-terminal domain (CTD) of the Pol II catalytic subunit Rbp1 (Schwer et al., 2009; Sanchez et al., 2018). The CTD of Rpb1 undergoes dynamic phosphorylation changes during transcriptional elongation, leading to the recruitment of different factors, including capping enzymes, elongation factors and histone modifiers (Coudreuse et al., 2010; Yague-Sanz et al., 2020). Csk1 phosphorylates the transcription factor TFII-associated CDK Mcs6 (CDK7 ortholog) and contributes to the phosphorylation of the CTD of Rpb1 (Hermand et al., 1998; Lee et al., 1999; St. Amour et al., 2012). The catalytic activity of the CDK Mcs6 does not strictly depend on the cyclin component and it acts as a transcription factor TFII (TFIIH)-associated kinase (Lee et al., 1999; Viladevall et al., 2009). The Mcs6 complex phosphorylates the Pol II CTD and recruits the Cdk9 complex containing the cap methyltransferase Pcm1, resulting in further phosphorylation of Pol II CTD by the Cdk9 complex, pre-mRNA elongation and completion of the 5′-cap structure (Saha et al., 1999; Pei and Shuman, 2003; Viladevall et al., 2009; Coudreuse et al., 2010; St Amour et al., 2012; Paparidis et al., 2017). Furthermore, Cdk9 phosphorylates the CTD of the transcription elongation factor Spt5 and relieves Spt5-dependent elongation arrest (Pei and Shuman, 2003; Viladevall et al., 2009; Schwer et al., 2009; Parua et al., 2018). The complex consisting of Spt5 and Spt4 regulates the early transcriptional elongation of Pol II and acts on pre-mRNA processing through physical interactions with mRNA-capping enzymes (Schwer et al., 2009). CKI: CDK inhibitor.

Similar articles

References

    1. Álvarez, B. and Moreno, S. (2006). Fission yeast Tor2 promotes cell growth and represses cell differentiation. J. Cell Sci. 119, 4475-4485. 10.1242/jcs.03241 - DOI - PubMed
    1. Azuma, K., Ohtsuka, H., Murakami, H. and Aiba, H. (2012). Extension of chronological lifespan by ScEcl1 depends on mitochondria in Saccharomyces cerevisiae. Biosci. Biotechnol. Biochem. 76, 1938-1942. 10.1271/bbb.120427 - DOI - PubMed
    1. Benito, J., Martín-Castellanos, C. and Moreno, S. (1998). Regulation of the G1 phase of the cell cycle by periodic stabilization and degradation of the p25rum1 CDK inhibitor. EMBO J. 17, 482-497. 10.1093/emboj/17.2.482 - DOI - PMC - PubMed
    1. Benjamin, B., Garg, A., Jork, N., Jessen, H. J., Schwer, B. and Shuman, S. (2022). Activities and structure-function analysis of fission yeast inositol pyrophosphate (IPP) kinase-pyrophosphatase Asp1 and its impact on regulation of pho1 gene expression. MBio 13, e0103422. 10.1128/mbio.01034-22 - DOI - PMC - PubMed
    1. Carter-O'connell, I., Peel, M. T., Wykoff, D. D. and O'shea, E. K. (2012). Genome-wide characterization of the phosphate starvation response in Schizosaccharomyces pombe. BMC Genomics 13, 1. 10.1186/1471-2164-13-697 - DOI - PMC - PubMed

Publication types

MeSH terms