

Inner pore hydration free energy controls the activation of big potassium channels
- PMID: 36774534
- PMCID: PMC10111268
- DOI: 10.1016/j.bpj.2023.02.005
Inner pore hydration free energy controls the activation of big potassium channels
Abstract
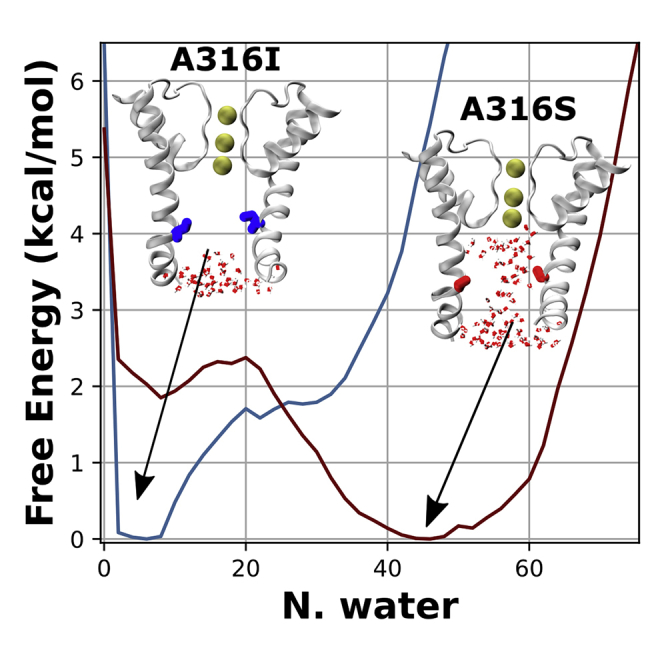
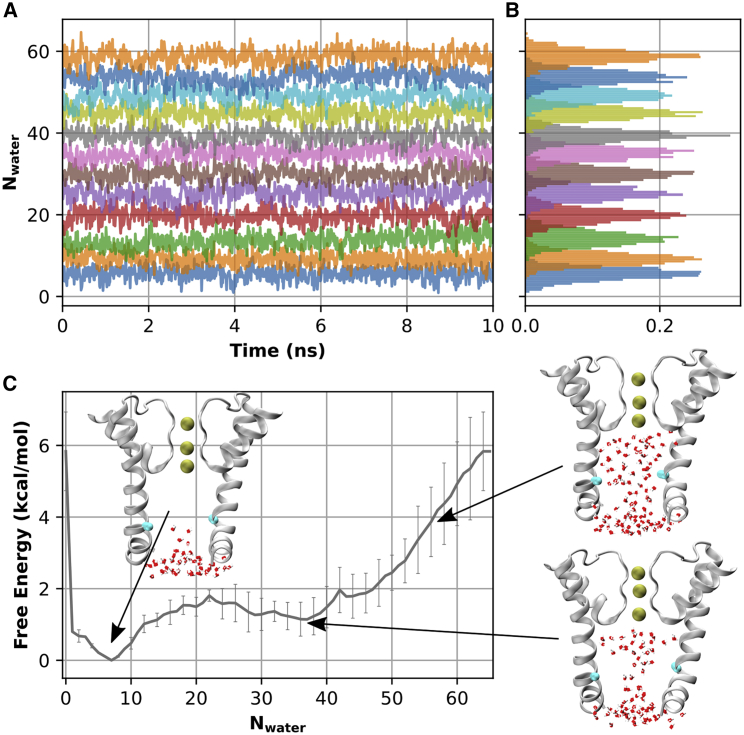
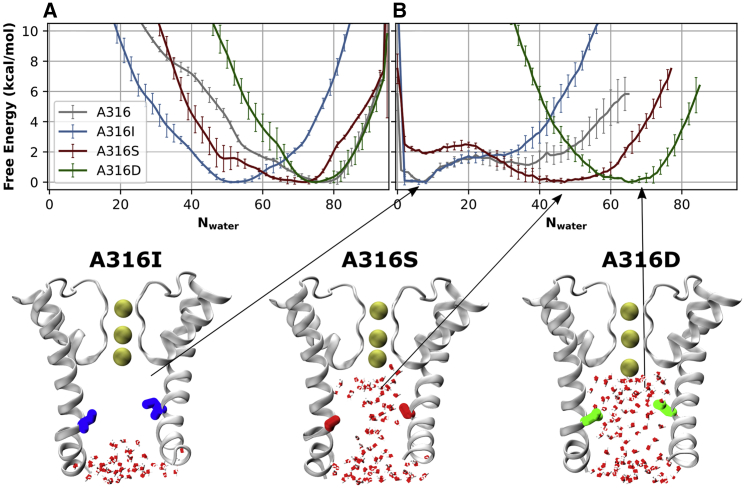
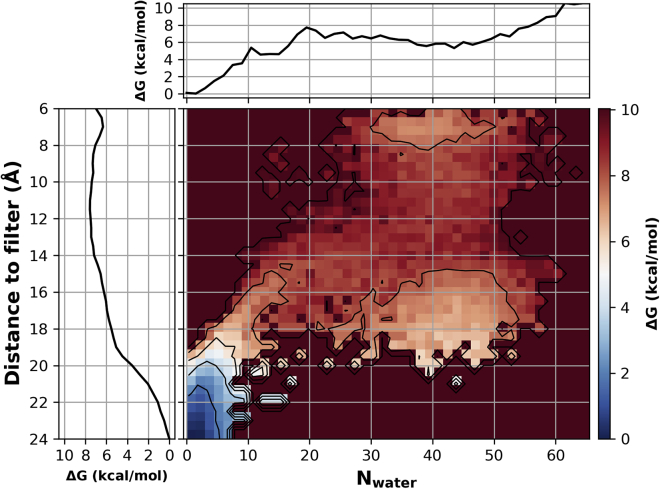
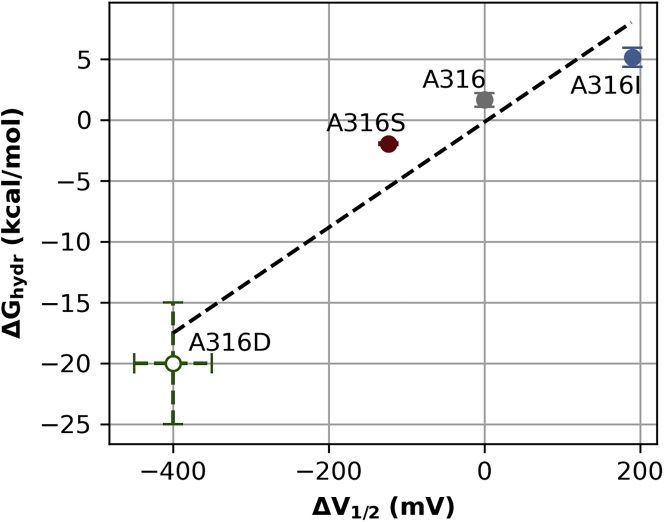
Hydrophobic gating is an emerging mechanism in regulation of protein ion channels where the pore remains physically open but becomes dewetted to block ion permeation. Atomistic molecular dynamics simulations have played a crucial role in understanding hydrophobic gating by providing the molecular details to complement mutagenesis and structural studies. However, existing studies rely on direct simulations and do not quantitatively describe how the sequence and structural changes may control the delicate liquid-vapor equilibrium of confined water in the pore of the channel protein. To address this limitation, we explore two enhanced sampling methods, namely metadynamics and umbrella sampling, to derive free-energy profiles of pore hydration in both the closed and open states of big potassium (BK) channels, which are important in cardiovascular and neural systems. It was found that metadynamics required substantially longer sampling times and struggled to generate stably converged free-energy profiles due to the slow dynamics of cooperative pore water diffusion even in the barrierless limit. Using umbrella sampling, well-converged free-energy profiles can be readily generated for the wild-type BK channels as well as three mutants with pore-lining mutations experimentally known to dramatically perturb the channel gating voltage. The results show that the free energy of pore hydration faithfully reports the gating voltage of the channel, providing further support for hydrophobic gating in BK channels. Free-energy analysis of pore hydration should provide a powerful approach for quantitative studies of how protein sequence, structure, solution conditions, and/or drug binding may modulate hydrophobic gating in ion channels.
Copyright © 2023 Biophysical Society. Published by Elsevier Inc. All rights reserved.
Conflict of interest statement
Declaration of interests The authors declare no competing interests.
Figures
Similar articles
-
Incorporating physics to overcome data scarcity in predictive modeling of protein function: a case study of BK channels.bioRxiv [Preprint]. 2023 Jun 26:2023.06.24.546384. doi: 10.1101/2023.06.24.546384. bioRxiv. 2023. Update in: PLoS Comput Biol. 2023 Sep 15;19(9):e1011460. doi: 10.1371/journal.pcbi.1011460. PMID: 37425916 Free PMC article. Updated. Preprint.
-
Hydrophobic gating in BK channels.Nat Commun. 2018 Aug 24;9(1):3408. doi: 10.1038/s41467-018-05970-3. Nat Commun. 2018. PMID: 30143620 Free PMC article.
-
Small Molecule NS11021 Promotes BK Channel Activation by Increasing Inner Pore Hydration.J Chem Inf Model. 2024 Oct 14;64(19):7616-7625. doi: 10.1021/acs.jcim.4c01012. Epub 2024 Sep 12. J Chem Inf Model. 2024. PMID: 39264311
-
Hydrophobic gating in ion channels.J Mol Biol. 2015 Jan 16;427(1):121-30. doi: 10.1016/j.jmb.2014.07.030. Epub 2014 Aug 12. J Mol Biol. 2015. PMID: 25106689 Free PMC article. Review.
-
Hydrophobic dewetting in gating and regulation of transmembrane protein ion channels.J Chem Phys. 2020 Sep 21;153(11):110901. doi: 10.1063/5.0017537. J Chem Phys. 2020. PMID: 32962356 Free PMC article. Review.
Cited by
-
Incorporating physics to overcome data scarcity in predictive modeling of protein function: a case study of BK channels.bioRxiv [Preprint]. 2023 Jun 26:2023.06.24.546384. doi: 10.1101/2023.06.24.546384. bioRxiv. 2023. Update in: PLoS Comput Biol. 2023 Sep 15;19(9):e1011460. doi: 10.1371/journal.pcbi.1011460. PMID: 37425916 Free PMC article. Updated. Preprint.
-
A hydrophobic funnel governs monovalent cation selectivity in the ion channel TRPM5.Biophys J. 2024 Oct 1;123(19):3304-3316. doi: 10.1016/j.bpj.2024.07.035. Epub 2024 Jul 30. Biophys J. 2024. PMID: 39086136 Free PMC article.
-
Electronic Polarization Leads to a Drier Dewetted State for Hydrophobic Gating in the Big Potassium Channel.J Phys Chem Lett. 2024 Jul 25;15(29):7436-7441. doi: 10.1021/acs.jpclett.4c01359. Epub 2024 Jul 15. J Phys Chem Lett. 2024. PMID: 39008088
-
Hydrophobic gating in bundle-crossing ion channels: a case study of TRPV4.Commun Biol. 2023 Oct 27;6(1):1094. doi: 10.1038/s42003-023-05471-0. Commun Biol. 2023. PMID: 37891195 Free PMC article.
-
Incorporating physics to overcome data scarcity in predictive modeling of protein function: A case study of BK channels.PLoS Comput Biol. 2023 Sep 15;19(9):e1011460. doi: 10.1371/journal.pcbi.1011460. eCollection 2023 Sep. PLoS Comput Biol. 2023. PMID: 37713443 Free PMC article.
References
Publication types
MeSH terms
Substances
Grants and funding
LinkOut - more resources
Full Text Sources
