Review
. 2023 Feb 1;24(3):2821.
doi: 10.3390/ijms24032821.

Why Are Some People with Lower Urinary Tract Symptoms (LUTS) Depressed? New Evidence That Peripheral Inflammation in the Bladder Causes Central Inflammation and Mood Disorders

Affiliations
Review

Why Are Some People with Lower Urinary Tract Symptoms (LUTS) Depressed? New Evidence That Peripheral Inflammation in the Bladder Causes Central Inflammation and Mood Disorders

Francis M Hughes Jr et al. Int J Mol Sci. .

Abstract

Anecdotal evidence has long suggested that patients with lower urinary tract symptoms (LUTS) develop mood disorders, such as depression and anxiety, at a higher rate than the general population and recent prospective studies have confirmed this link. Breakthroughs in our understanding of the diseases underlying LUTS have shown that many have a substantial inflammatory component and great strides have been made recently in our understanding of how this inflammation is triggered. Meanwhile, studies on mood disorders have found that many are associated with central neuroinflammation, most notably in the hippocampus. Excitingly, work on other diseases characterized by peripheral inflammation has shown that they can trigger central neuroinflammation and mood disorders. In this review, we discuss the current evidence tying LUTS to mood disorders, its possible bidirectionally, and inflammation as a common mechanism. We also review modern theories of inflammation and depression. Finally, we discuss exciting new animal studies that directly tie two bladder conditions characterized by extensive bladder inflammation (cyclophosphamide-induced hemorrhagic cystitis and bladder outlet obstruction) to neuroinflammation and depression. We conclude with a discussion of possible mechanisms by which peripheral inflammation is translated into central neuroinflammation with the resulting psychiatric concerns.

Keywords: bladder; cystitis; depression; inflammation; lower urinary tract symptoms; mood disorders.


Conflict of interest statement

The authors declare no conflict of interest.

Figures
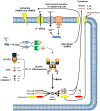
Figure 1
Figure 1
Illustration of the NLRP3 inflammasome, pathways of activation and biochemical mechanism of action. As described in the text, the NLRP3 inflammasome can be activated by DAMPS and PAMPS in a multitude of ways, mostly illustrated at the top membrane. DAMPs may also alter release of ROS which free TXNIP to stabilize a developing NLRP3 oligomer. Upon activation, the NLRP3 inflammasome assimilates and activates caspase-1 which cleaves pro-IL-1β and pro-IL-18 into their active forms. It also cleaves Gasdermin D and the N-terminus forms a pore in the plasma membrane. This pore facilitates release of IL-1β and IL-18 to act locally and systemically as a pro-inflammatory cytokine. The Gasdermin D pore also releases intracellular DAMPS which can affect neighboring cells to trigger further NLRP3 activation in a feed-forward mechanism. This figured was modified, with permission from Wolters Kluwer, from [81] and incorporates portions from [80] (open access).
Figure 2
Figure 2
Illustration of the numerous Urological Conditions with an Inflammatory Component (UCICs). There are a number of conditions in the bladder that have been shown to be associated with inflammation, either as an initiating etiology or a contributing factor. These are illustrated with inwardly pointing arrows. Many of these are associated with common outcomes indicated by outgoing arrows and surrounded by a dashed box. Not all outcomes are associated with all UCICs. NLRP3 in the bladder has been shown to play a critical role in the underlined conditions. Some of these conditions have been associated, directly or anecdotally, with mood disorders.
Figure 3
Figure 3
CP induces behavioral signs of depression through NLRP3. (A). Sucrose preference test. A reduction of preference indicates depression. Bars represent the mean ± SEM. [Vehicle: n = 10; GLY: n = 4; CP: n = 8; CP + GLY = 6; CP + Mesna = 12; GP + FLU=8]. * p < 0.05 and ** p < 0.01 by one-way ANOVA and Student-Newman-Keuls post-hoc analysis. (B). Forced Swim assay. An increase in time spent immobile indicates depression. Bars represent the mean ± SEM. [Vehicle: n = 9; GLY: n = 18; CP: n = 8; CP + GLY = 18; CP + Mesna = 6; GP + FLU = 11]. * p < 0.05, ** p < 0.01 and *** p < 0.001 by one-way ANOVA and Student-Newman-Keuls post-hoc analysis. This figured was reprinted, with permission from the American Physiological Society, from [10].
Figure 4
Figure 4
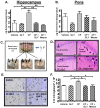
CP-induced cystitis results in inflammation and breakdown of the blood brain barrier in the hippocampus, not in the pons. Administration of GLY or Mesna blocks this effect. (A). Evans blue extravasation was increased in the Hippocampus by CP. This increase was prevented by treatment with Gly or Mesna. All results were calculated as pg of Evans blue per μg of tissue. Bars represent mean ± SEM. For A: Vehicle: n = 3; GLY: n = 3; CP: n = 4; CP + GLY: n = 4; CP + Mesna: n = 4. For B: Vehicle: n = 4; GLY: n = 3; CP: n = 4; CP + GLY: n = 4; CP + Mesna: n = 8. * p < 0.05, ** p < 0.01 by one-way ANOVA and Student-Newman-Keuls post-hoc analysis. (B). Evans blue extravasation was not significantly changed in the pons by any treatment. (C). CP-induced cystitis results in areas of gross blood brain barrier breakdown, with Evans blue dye apparent (arrows) in the periventricular region of the hippocampus. A CP-treated rat was injected with Evans blue as described in the Methods section. After 1 h the brain was removed, sectioned coronally with a scalpel at the approximate locations indicated and photographed. (D). CP results in an NLRP3-dependent increase in number of microglia-like cells within the fascia dentata of the hippocampus. Coronal sections (10 µm) were cut through the hippocampus and an H&E stain was performed using routine methodical techniques. Slides were visualized at 60×. Activated glial cells are indicated by arrows. (E). Immunohistochemistry shows increased density of activated microglia within the fascia dentata. Coronal sections (10 µm) were cut and Immunohistochemistry was performed using an anti-IbA1/AIF1 antibody and routine histological methods. Slides were visualized at 20× and the number of microglia was quantitated. Arrows demonstrating increased glial processes (arrows) at higher magnification are shown. (F). Density of Microglia. Results are depicted as the number of microglia per μm2. Bars represent mean ± SEM. [Vehicle: n = 5; GLY: n = 6; CP: n = 7; CP + GLY: n = 4; CP + Mesna: n = 8]. * p < 0.05 by one-way ANOVA and Student-Newman-Keuls post-hoc analysis. This figured was reprinted, with permission from the American Physiological Society, from [10].
Figure 5
Figure 5
After 12 weeks of BOO, rats show signs of depression. These behavior differences were not present when rats were given glyburide or fluoxetine (Flu), an anti-depressant. (A). The sucrose preference assay (a measure of anhedonia). The assay was performed as described in the Materials and Methods section. The results are presented as the amount of sucrose laden water consumed as a percentage of the total volume imbibed. Veh = vehicle-treated, Gly = glyburide-treated. Results are the mean ± 95% confidence intervals; * p < 0.05, ** p < 0.01 and *** p < 0.005 by ANOVA and Dunn’s test. (n = 24, 24, 14, 14, 6). This figured was reprinted, with permission from the Wiley Periodicals, from [9]. (B). The open field assay (a measure of anxiety.) The assay was performed as described in the Materials and Methods section and scored by a blinded investigator. The results are presented as the time in which at least 2 paws were present in the middle section of the open field during the 10 min test session. Veh = vehicle-treated, Gly = glyburide-treated. Results are the mean ± 95% confidence intervals; * p < 0.05 and ** p < 0.01 by ANOVA and Dunn’s test. (n = 26, 23, 15, 13, 6).
Figure 6
Figure 6
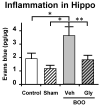
After 12 weeks of BOO, inflammation is present in the hippocampus of rats. This inflammation is blocked by concomitant treatment with glyburide. Following the treatments indicated, inflammation was assessed by the Evans blue assay as described in the Materials and Methods section. Veh = vehicle-treated, Gly = glyburide-treated. Results are the mean ± 95% confidence intervals; * p < 0.05 and ** p < 0.01 by ANOVA and Dunn’s test. (n = 8, 7, 12, 8). This figured was reprinted, with permission from the Wiley Periodicals, from [9].
Figure 7
Figure 7
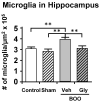
After 12 weeks of BOO the number of activated microglia in the hippocampus is increased and this increase was blocked by glyburide treatment. Activated microglia in 10 µm sections of brain were stained for IbA1/AIF1 and then visualized and quantitated. The results are presented as the density of activated microglia per µm2. Veh = vehicle-treated, Gly = glyburide-treated. Results are the mean ± 95% confidence intervals; ** p < 0.01 by ANOVA and Dunn’s test. (n = 7, 6, 8, 7). This figured was reprinted, with permission from the Wiley Periodicals, from [9].
Figure 8
Figure 8
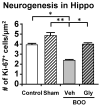
After 12 weeks of BOO, neurogenesis is statistically decreased in the hippocampus and this increase is blocked by glyburide treatment. Cells in 10 µm sections of brain were stained for Ki-67 and then visualized and quantitated as described in the Materials and Method section. The results are presented as the density of Ki-67+ cells per µm2. Veh = vehicle-treated, Gly = glyburide-treated. Results are the mean ± 95% confidence intervals; * p < 0.5 and ** p < 0.01 by ANOVA and Dunn’s test. (n = 6, 6, 6, 6). This figured was reprinted, with permission from the Wiley Periodicals, from [9].
Figure 9
Figure 9
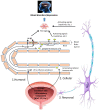
Illustration of possible mechanisms by which inflammation in the bladder caused by a Urinary Condition with an Inflammatory Component (UCIC) is converted into neuroinflammation in the CNS. Depicted are three possible mechanisms that can convey a signal of inflammation into the CNS where its translated into neuroinflammation, perhaps in many areas but most certainly in the hippocampus. 1. The humoral pathway whereby proinflammatory cytokines are released from the bladder and transferred to the brain trough the circulatory system. There they pass through the BBB (either paracellularly or through transporters) and into the brain where they activate microglia (and perhaps astrocytes) to trigger neuroinflammation and mood disorders. 2. The cellular pathway whereby immune cells are activated in the periphery and travel through the circulatory system to the brain where the cross the BBB through extravasation as well as pores in the endothelial cells themselves. Inside the BBB they activate microglia (and perhaps astrocytes), triggering inflammation and mood disorders. 3. The neural pathway whereby activating signals (cytokines, etc.) are carried into the brain through ascending fibers to activate microglia (and perhaps astrocytes) to trigger inflammation and mood disorders. Some image(s) used under license from Shutterstock.com (hippocampus, microglia and neuron).

Similar articles

Cited by

References

    1. Hollander A., Gordon J.R., Sloan B.S. Infravesical Obstruction and Its Relationship to Edema and Psychotic Behavior. South. Med. J. 1964;57:63–65. doi: 10.1097/00007611-196401000-00012. - DOI - PubMed
    1. Coyne K.S., Wein A.J., Tubaro A., Sexton C.C., Thompson C.L., Kopp Z.S., Aiyer L.P. The burden of lower urinary tract symptoms: Evaluating the effect of LUTS on health-related quality of life, anxiety and depression: EpiLUTS. BJU Int. 2009;103:4–11. doi: 10.1111/j.1464-410X.2009.08371.x. - DOI - PubMed
    1. Lim Y.-M., Lee S.R., Choi E.J., Jeong K., Chung H.W. Urinary incontinence is strongly associated with depression in middle-aged and older Korean women: Data from the Korean longitudinal study of ageing. Eur. J. Obstet. Gynecol. Reprod. Biol. 2018;220:69–73. doi: 10.1016/j.ejogrb.2017.11.017. - DOI - PubMed
    1. Dunphy C., Laor L., Te A., Kaplan S., Chughtai B. Relationship Between Depression and Lower Urinary Tract Symptoms Secondary to Benign Prostatic Hyperplasia. Rev. Urol. 2015;17:51–57. doi: 10.3909/riu0658. - DOI - PMC - PubMed
    1. Huang C.L.-C., Wu M.-P., Ho C.-H., Wang J.-J. The bidirectional relationship between anxiety, depression, and lower urinary track symptoms: A nationwide population-based cohort study. J. Psychosom. Res. 2017;100:77–82. doi: 10.1016/j.jpsychores.2017.07.008. - DOI - PubMed