. 2023 Jan 24;15(3):707.
doi: 10.3390/cancers15030707.

Chemotherapeutic Activity of Pitavastatin in Vincristine Resistant B-Cell Acute Lymphoblastic Leukemia

Affiliations

Chemotherapeutic Activity of Pitavastatin in Vincristine Resistant B-Cell Acute Lymphoblastic Leukemia

Debbie Piktel et al. Cancers (Basel). .

Abstract

B-cell acute lymphoblastic leukemia (ALL) is derived from an accumulation of malignant, immature B cells in the bone marrow and blood. Relapse due, in part, to the emergence of tumor cells that are resistant to front line standard chemotherapy is associated with poor patient outcomes. This challenge highlights the need for new treatment strategies to eliminate residual chemoresistant tumor cells. Based on the use of pitavastatin in acute myeloid leukemia (AML), we evaluated its efficacy in an REH ALL cell line derived to be resistant to vincristine. We found that pitavastatin inhibited the proliferation of both parental and vincristine-resistant REH tumor cells at an IC50 of 449 nM and 217 nM, respectively. Mitochondrial bioenergetic assays demonstrated that neither vincristine resistance nor pitavastatin treatment affected cellular oxidative phosphorylation, beta-oxidation, or glycolytic metabolism in ALL cells. In a co-culture model of ALL cells with bone marrow stromal cells, pitavastatin significantly decreased cell viability more robustly in the vincristine-resistant ALL cells compared with their parental controls. Subsequently, NSG mice were used to develop an in vivo model of B-cell ALL using both parental and vincristine-resistant ALL cells. Pitavastatin (10 mg/kg i.p.) significantly reduced the number of human CD45+ REH ALL cells in the bone marrow of mice after 4 weeks of treatment. Mechanistic studies showed that pitavastatin treatment in the vincristine-resistant cells led to apoptosis, with increased levels of cleaved PARP and protein-signaling changes for AMP-activated protein kinase/FoxO3a/Puma. Our data suggest the possible repurposing of pitavastatin as a chemotherapeutic agent in a model of vincristine-resistant B-cell ALL.

Keywords: bone marrow; residual disease; sirtuins; statins.


Conflict of interest statement

The authors declare no conflict of interest.

Figures

Figure 1
Figure 1
Development of a vincristine-resistant REH cell culture model. REH cells were cultured in the presence of increasing concentrations of vincristine to select for a vincristine-resistant cell line (REH-VR). The REH and REH-VR cells were treated with DMSO vehicle control (Ctrl), vincristine (Vinc; 2 nM), cytarabine (Ara-C; 1 μM) or methotrexate (MTX; 4.5 nM). A Trypan Blue exclusion assay shows the (A) number of live cells and (B) percent viability where the data have been normalized to the DMSO control viability set at 100% following treatment. While the REH-VR cells showed resistance to vincristine, they were still sensitive to other standard of care agents Ara-C and MTX. Each bar is an average ± S.D., where n = 3; * p < 0.05 denotes statistical significance.
Figure 2
Figure 2
Pitavastatin reduces cell proliferation in leukemic cells. (A) REH and REH-VR were treated with pitavastatin for 48 h. (B) REH, REH-VR, REH-AR, and REH-MR cells were treated with pitavastatin for 48 h. The concentration of pitavastatin used was based on the IC50 values obtained from the inhibition curves (A), as well as an additional 2X the IC50 of REH. CCK-8 (WST-8) assay was used to determine cell proliferation. Data shown as fraction of control, or percent of control, when compared to vehicle control. The calculated IC50 values for the REH and REH-VR cells were 449 nM and 217 nM, respectively. Each symbol is average ± S.D., where n = 3.
Figure 3
Figure 3
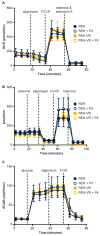
Pitavastatin treatment effects on mitochondrial bioenergetics. REH and REH-VR cells were treated with vehicle or 450 nM pitavastatin (Pit). Equal numbers of cells were plated in Seahorse 96-well plates. (A) Mitochondrial Stress Test. (B) Beta-oxidation assay. (C) Glycolysis assay. Pitavastatin did not significantly alter mitochondrial function in either cell type. Each data point represents average ± S.D., where n = 4. Abbreviations: 2-DG, 2-deoxyglucose; FCCP (carbonyl cyanide p-trifluoro methoxyphenylhydrazone); OCR (oxygen consumption rate); ECAR (extracellular acidification rate).
Figure 4
Figure 4
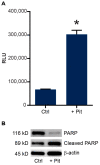
Pitavastatin treatment stimulates apoptosis in resistant cells. REH-VR cells were treated for 48 h with 450 nM pitavastatin (+ Pit) or DMSO vehicle control (Ctrl). (A) Increased activity of caspases-3 and -7 was observed in pitavastatin-treated REH-VR cells, where increase in relative luminescent units (RLU) indicated increased caspase activity. (B) Western blotting showed a decreased amount of PARP protein and an increased amount of cleaved PARP following treatment with pitavastatin. Bars represent average ± S.D., where n = 3; * p < 0.05 denotes statistical significance.
Figure 5
Figure 5
Pitavastatin effects on metabolic regulators. REH-VR cells were treated with 450 nM pitavastatin (+ Pit) or DMSO vehicle control (Ctrl). (AC) Western blot analysis shows phosphorylated and total protein levels following 48 h treatment. (D) Puma and (E) Sirt3 expression were also increased with Pit treatment. Phospho-FoxO3a blot shown is for phospho-FoxO3a (Ser413).
Figure 6
Figure 6
Co-culture model of leukemia cells with bone marrow stroma. Pitavastatin treatment reduced number of live cells in both the REH and REH-VR cells, at the concentrations tested. A Trypan Blue exclusion assay was used to analyze the suspended (S) (A,B) and phase dim (PD) (C,D) ALL cells from a co-culture following treatment with vehicle control (Ctrl) or pitavastatin (225 nM or 450 nM). Results are shown as the number of live cells (A,C) and the percent viable cells where the data have been normalized to the DMSO control viability set at 100% treatment (B,D). Each bar represents average ± S.D., where n = 3; * p < 0.05 denotes statistical significance when comparing REH and REH-VR for each treatment condition.
Figure 7
Figure 7
Combination treatment with pitavastatin and vincristine. REH and REH-VR cells were treated with either vehicle or pitavastatin (Pit, 450 nM) for 24 h, after which indicated cells were treated with either vincristine (Vinc, 2 nM), for an additional 48 h or total treatment time of 72 h and proliferation was determined with a CCK-8 (WST-8) assay. Pitavastatin did not show augmentation of vincristine activity. Each bar represents average ± S.D., where n = 3; * p < 0.05 denotes statistical significance.
Figure 8
Figure 8
B-cell ALL mouse model. REH and REH-VR cells were engrafted in NSG mice. Mice were treated daily with pitavastatin (Pit, 10 mg/kg i.p.) for 4 weeks, while control mice were treated with vehicle (Ctrl). The percentage of human CD45+ ALL cells was determined in the bone marrow cells of mouse femurs. Pitavastatin significantly reduced the percentage of CD45+ cells in both parental and vincristine-resistant cells. No statistical difference was found for percent CD45+ cells between the REH and the REH-VR for vehicle control mice. Each bar represents average ± S.D., where n = 5 mice; * p < 0.05 denotes statistical significance.
Figure 9
Figure 9
Pitavastatin in B-cell ALL. Pitavastatin treatment leads to increased activation of FoxO3a phosphorylation on S413, leading to Sirt3/Puma-mediated cell death. The AKT-mediated protection pathway was not activated with the treatment of pitavastatin [11]. Drawn using Biorender.

Similar articles

Cited by

References

    1. Delahaye M.C., Salem K.I., Pelletier J., Aurrand-Lions M., Mancini S.J.C. Toward Therapeutic Targeting of Bone Marrow Leukemic Niche Protective Signals in B-Cell Acute Lymphoblastic Leukemia. Front. Oncol. 2020;10:606540. doi: 10.3389/fonc.2020.606540. - DOI - PMC - PubMed
    1. Moses B.S., Slone W.L., Thomas P., Evans R., Piktel D., Angel P.M., Walsh C.M., Cantrell P.S., Rellick S.L., Martin K.H., et al. Bone marrow microenvironment modulation of acute lymphoblastic leukemia phenotype. Exp. Hematol. 2016;44:50–59. doi: 10.1016/j.exphem.2015.09.003. e51-52. - DOI - PMC - PubMed
    1. Moses B.S., Evans R., Slone W.L., Piktel D., Martinez I., Craig M.D., Gibson L.F. Bone Marrow Microenvironment Niche Regulates miR-221/222 in Acute Lymphoblastic Leukemia. Mol. Cancer Res. 2016;14:909–919. doi: 10.1158/1541-7786.MCR-15-0474. - DOI - PMC - PubMed
    1. Dalton W.S., Hazlehurst L., Shain K., Landowski T., Alsina M. Targeting the bone marrow microenvironment in hematologic malignancies. Semin. Hematol. 2004;41:1–5. doi: 10.1053/j.seminhematol.2004.02.001. - DOI - PubMed
    1. Allegra A., Gioacchino M.D., Tonacci A., Petrarca C., Gangemi S. Nanomedicine for Immunotherapy Targeting Hematological Malignancies: Current Approaches and Perspective. Nanomaterials. 2021;11:2792. doi: 10.3390/nano11112792. - DOI - PMC - PubMed