. 2023 Jan 23:14:1099246.
doi: 10.3389/fimmu.2023.1099246. eCollection 2023.

Persistent T cell-mediated immune responses against Omicron variants after the third COVID-19 mRNA vaccine dose

Affiliations

Persistent T cell-mediated immune responses against Omicron variants after the third COVID-19 mRNA vaccine dose

Milja Belik et al. Front Immunol. .

Abstract

Introduction: The prime-boost COVID-19 mRNA vaccination strategy has proven to be effective against severe COVID-19 disease and death. However, concerns have been raised due to decreasing neutralizing antibody levels after COVID-19 vaccination and due to the emergence of new immuno-evasive SARS-CoV-2 variants that may require additional booster vaccinations.

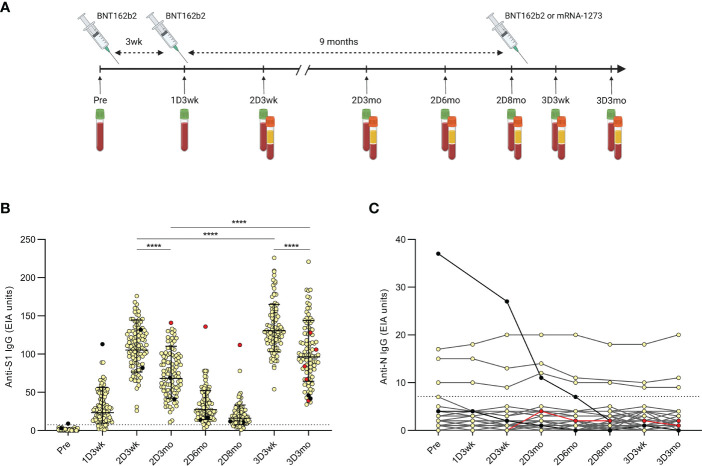
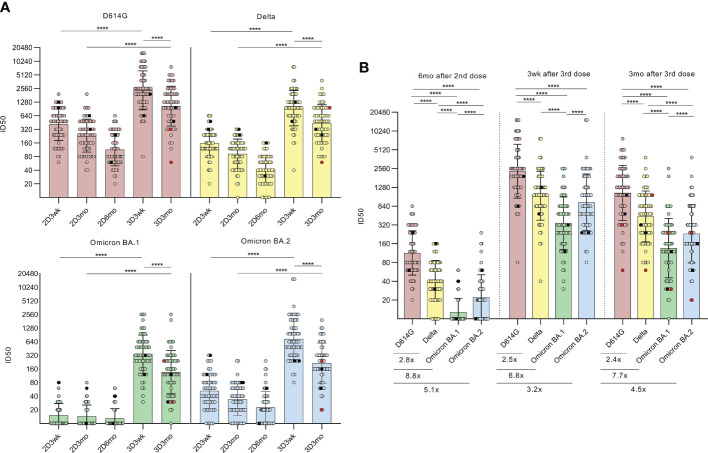
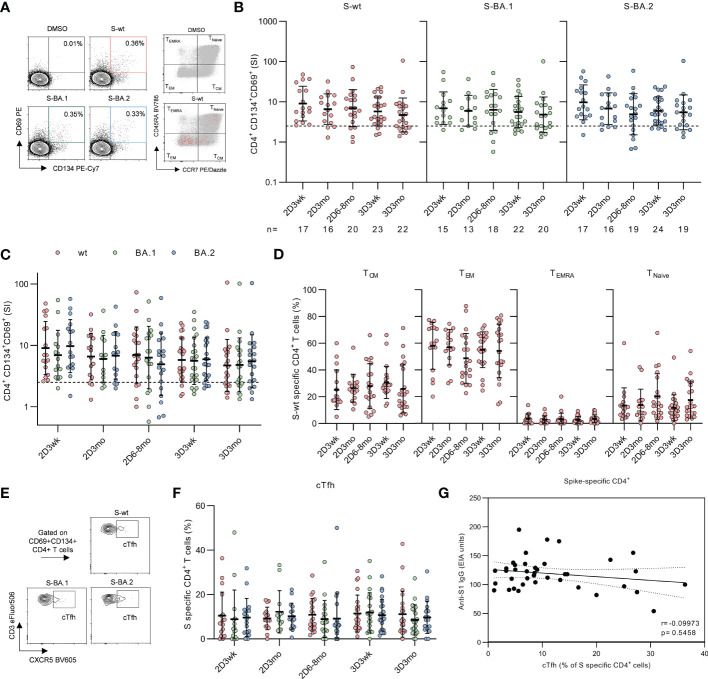
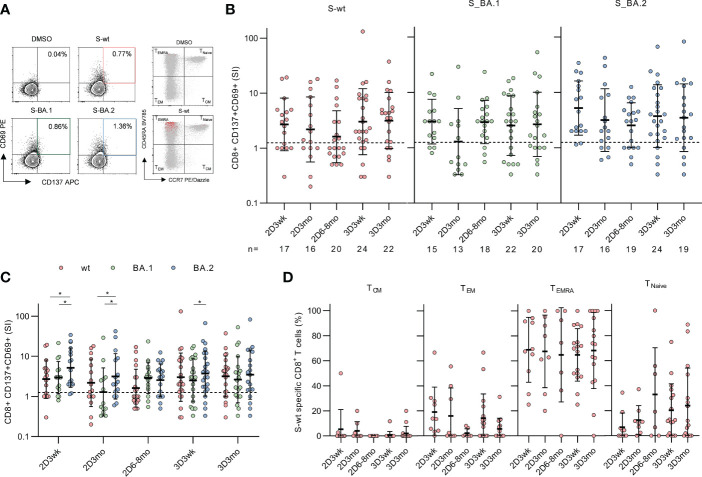
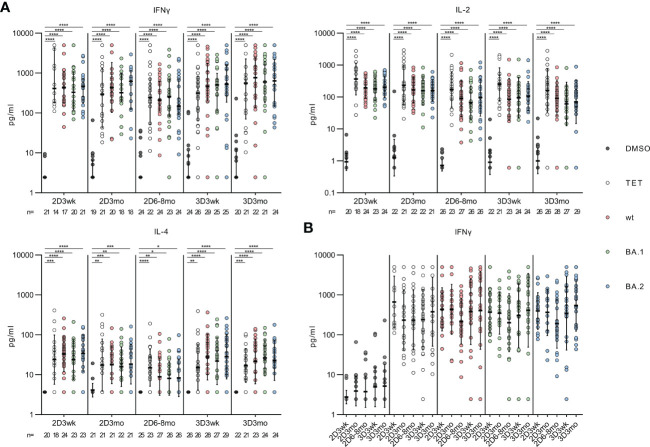
Methods: In this study, we analyzed the humoral and cell-mediated immune responses against the Omicron BA.1 and BA.2 subvariants in Finnish healthcare workers (HCWs) vaccinated with three doses of COVID-19 mRNA vaccines. We used enzyme immunoassay and microneutralization test to analyze the levels of SARS-CoV-2 specific IgG antibodies in the sera of the vaccinees and the in vitro neutralization capacity of the sera. Activation induced marker assay together with flow cytometry and extracellular cytokine analysis was used to determine responses in SARS-CoV-2 spike protein stimulated PBMCs.

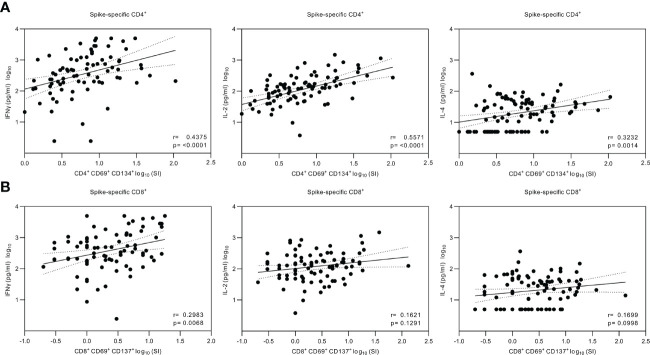
Results: Here we show that within the HCWs, the third mRNA vaccine dose recalls both humoral and T cell-mediated immune responses and induces high levels of neutralizing antibodies against Omicron BA.1 and BA.2 variants. Three weeks after the third vaccine dose, SARS-CoV-2 wild type spike protein-specific CD4+ and CD8+ T cells are observed in 82% and 71% of HCWs, respectively, and the T cells cross-recognize both Omicron BA.1 and BA.2 spike peptides. Although the levels of neutralizing antibodies against Omicron BA.1 and BA.2 decline 2.5 to 3.8-fold three months after the third dose, memory CD4+ T cell responses are maintained for at least eight months post the second dose and three months post the third vaccine dose.

Discussion: We show that after the administration of the third mRNA vaccine dose the levels of both humoral and cell-mediated immune responses are effectively activated, and the levels of the spike-specific antibodies are further elevated compared to the levels after the second vaccine dose. Even though at three months after the third vaccine dose antibody levels in sera decrease at a similar rate as after the second vaccine dose, the levels of spike-specific CD4+ and CD8+ T cells remain relatively stable. Additionally, the T cells retain efficiency in cross-recognizing spike protein peptide pools derived from Omicron BA.1 and BA.2 subvariants. Altogether our results suggest durable cellmediated immunity and protection against SARS-CoV-2.

Keywords: COVID-19; T cell responses; booster vaccine; mRNA vaccines; omicron; third vaccine dose.


Conflict of interest statement

The authors declare that the research was conducted in the absence of any commercial or financial relationships that could be construed as a potential conflict of interest.

Figures

Figure 1
Figure 1
Timeline of the COVID-19 vaccinations and samplings of the HCWs and antibody levels after the second and third COVID-19 mRNA vaccine doses. (A), Serum samples and peripheral blood mononuclear cells (PBMCs) were collected at regular intervals from health care workers (HCWs, n=100) vaccinated with two sequential doses of BNT162b2 (BioNTech-Pfizer) and a third mRNA vaccine dose of either BNT162b2 (n=46) or mRNA-1273 (Moderna; n=54). Sera were collected before the first vaccination and up to three months after the third dose and PBMCs were collected from a proportion of the HCWs (n=32) at indicated time points. (B), SARS-CoV-2 S1-specific IgG antibody levels were measured with EIA from the serum samples collected before the first vaccination (Pre; n=100), three weeks after the first vaccination (1D3wk; n=99), three weeks (2D3wk; n=100), three months (2D3mo; n=99), six months (2D6mo; n=100), and eight months (2D8mo; n=85) after the second vaccine dose, and three weeks (3D3wk; n=100) and three months (3D3mo; n=94) after the third vaccine dose. Geometric means with geometric SDs are shown. Wilcoxon signed-rank test was used to analyze the statistical significance between time points (2D3wk vs 2D3mo; 2D3wk vs 3D3wk; 3D3wk vs 3D3mo; 2D3mo vs 3D3mo), and two-tailed p-values <0.05 were considered statistically significant. ****p<0.0001. (C), SARS-CoV-2 N-specific IgG antibody levels were measured with EIA from the same samples as the S1-specific IgG antibodies. Black dots represent HCWs with a PCR-confirmed SARS-CoV-2 infection prior to the first vaccination (n=2) and red dots represent HCWs with a breakthrough infection after the second vaccine dose (n=1) or after the third vaccine dose (n=4). Cut-off values are indicated with dashed lines.
Figure 2
Figure 2
Neutralizing antibodies after the second and third COVID-19 mRNA vaccine doses. (A), Microneutralization test was used to analyze the neutralizing antibody responses of HCWs (n=64) against D614G strain and variants Delta, BA.1, BA.2 after the second vaccine dose at three-week (2D3wk, n=60, BA.2 n=59), three-month (2D3mo, n=60, BA.2 n=59) and six-month (2D6mo, n=62, BA.2 n=61) time points as well as after the third vaccine dose at three-week (3D3wk, n=63, BA.2 n=62) and three-month (3D3mo, n=59, BA.2 n=58) time points. HCWs with PCR-confirmed SARS-CoV-2 infection prior to the first vaccination (n=2) are marked with black dots and breakthrough infections after the third dose (n=2) are marked with red dots. Differences between time points (2D3wk vs 3D3wk; 2D3mo vs 3D3mo; 3D3wk vs 3D3mo) were analyzed with Wilcoxon signed-rank test. (B), Neutralization titers between D614G strain and variants Delta, BA.1, and BA.2 at six months after the second vaccine dose as well as three weeks and three months after the third vaccine dose were compared and are represented as fold differences below the figures. Wilcoxon signed-rank test was used to analyze the statistical significance, and two-tailed p-values <0.05 were considered statistically significant. Samples with no data on both data points were excluded from the analyses. The geometric means with geometric SDs are shown in the figures. ****p<0.0001.
Figure 3
Figure 3
CD4+ T cell responses to SARS-CoV-2 wild type and Omicron BA.1 and BA.2 spike protein peptides after second and third mRNA vaccination doses. (A), Representative flow cytometry plots and gating of CD4+ T cells expressing CD69+CD134+ and distribution of memory phenotypes of total CD4+ (gray) and activated CD4+CD69+CD134+ (red) T cells after stimulation with DMSO or SARS-CoV-2 (wt, BA.1, and BA.2) spike peptide pools. The gating strategy of CD4+ T cells is shown in Supplementary Figure 3 . (B), Longitudinal spike-specific CD4+ T cell responses were analyzed from 32 vaccinated HCWs three weeks (2D3wk), three months (2D3mo), and six to eight months (2D6–8mo) after the second vaccine dose, and three weeks (3D3wk) and three months (3D3mo) post the third vaccine dose. Data are shown as stimulation indices (SI) relative to DMSO-stimulated PBMCs. The dotted line indicates the cut-off SI and the numbers below represent the sample size. (C), Comparison of SARS-CoV-2 wild type and Omicron BA.1 and BA.2 variant spike peptide pool specific CD4+ T cell responses. (D), Proportions of memory phenotypes of SARS-CoV-2 wild type spike-specific CD4+ T cells after the second and third vaccine doses. Responses are shown only for samples with spike-specific CD4+ T cell response >1 SI. Total CD4+ T cell responses and distribution areshown in Supplementary Figure 5 . (E), Representative flow cytometry plots of circulating T follicular helper (cTfh, CXCR5+) cells expressing CD4+CD69+CD134+ in response to stimulation with SARS-CoV-2 wild type and Omicron BA.1 and BA.2 variant spike peptide pools. (F), Proportion of CD4+CD69+CD134+ T cells expressing CXCR5+. (G), Correlation between the SARS-CoV-2 S1-specific IgG antibody levels at three weeks after the second (n=16) and third (n=23) vaccine doses and SARS-CoV-2 wild type stimulated cTfh cells expressing CD4+CD69+CD134+ at corresponding time points. Error bars in panels b and c represent geometric means and geometric SDs, and in d and f means with SDs. In b and d, the statistical significance was determined with the Kruskal-Wallis test followed by Dunn’s multiple comparisons test since some participants were missing samples from individual time points. In c and f the statistical significance was determined with Wilcoxon signed-rank test for paired samples. CM; central memory, EM; effector memory, TEMRA; T effector memory CD45RA+.
Figure 4
Figure 4
CD8+ T cell responses to SARS-CoV-2 wild type and Omicron BA.1 and BA.2 spike after the second and third mRNA vaccine dose. (A), Representative flow cytometry plots and gating of CD8+CD69+CD137+ T cells and memory phenotypes of total CD8+ (gray) and activated CD8+CD69+CD137+ (red) T cells after stimulation with DMSO and SARS-CoV-2 (wt, BA.1, and BA.2) spike peptide pools. The gating strategy of CD8+ T cells is shown in Supplementary Figure 3 . (B), Spike-specific CD8+ T cell responses in 32 vaccinated HCWs three weeks (2D3wk), three months (2D3mo), and six to eight months (2D6–8mo) after two vaccine doses, and three weeks (3D3wk) and three months (3D3mo) post the third vaccine dose represented longitudinally. The dotted line indicates the cut-off SI and the numbers below represent the sample size. (C), Cross-comparison of CD8+ T cell responses after stimulation with wild type and Omicron BA.1 and BA.2 spike peptide pools. (D), Distribution of S-wt-specific CD8+ T cells expressing CD69+CD137+ into memory subsets after the second and the third vaccine dose. Responses are shown only for samples with spike-specific CD8+ T cell response >1 SI. Total CD8+ T cell responses and distribution are shown in Supplementary Figure 5 . Error bars in (B-C) represent the geometric means with geometric SDs, and in d the means with SDs. In b and d, the statistical significance was determined with the Kruskal-Wallis test followed by Dunn’s multiple comparisons test since some participants were missing samples from individual time points. In (C), the statistical significance was determined with Wilcoxon signed-rank test for paired samples: *p<0.05. CM, central memory; EM, effector memory; TEMRA, T effector memory CD45RA+.
Figure 5
Figure 5
Effector cytokines IFN-γ, IL-2 and IL-4 secreted by the SARS-CoV-2 spike protein stimulated PBMCs. (A), Secreted cytokines (IFN-γ, IL-2 and IL-4) were analyzed from the supernant of DMSO, tetanus toxoid (TET), and SARS-CoV-2 (wt, BA.1, and BA.2) spike protein peptide pool -stimulated PBMCs collected from 32 HCWs. (B), Comparison of the secreted IFN-γ levels at indicated time points. The data are represented as geometric means with geometric SDs. The statistical significances were determined with the Kruskal-Wallis test followed by Dunn’s multiple comparisons test. *p<0.05; **p <0.01; ***p <0.001; ****p <0.0001.
Figure 6
Figure 6
Correlation of the secreted cytokines and SARS-CoV-2 spike-specific T cell responses. (A), Nonparametric Spearman correlation analysis of SARS-CoV-2 (wt) spike-specific CD4+ T cells and secreted IFN-γ, IL-2 or IL-4 cytokines measured from the supernatants of SARS-CoV-2 (wt) spike-stimulated PBMCs. The stimulated PBMCs were collected from 32 HCWs at three weeks, three, and six to eight months after the second vaccine dose and three weeks and three months after the third vaccine dose and grouped together for analysis (n=81 for IFN-γ, n=87 for IL-2, and n=88 for IL-4). (B), Nonparametric Spearman correlation analysis of SARS-CoV-2 (wt) spike-specific CD8+ T cells and secreted cytokines (n=81 for IFN-γ, n=88 for IL-2, and n=88 for IL-4). Dotted lines indicate 95% confidence intervals (CI).

Similar articles

Cited by

References

    1. Hurme A, Jalkanen P, Heroum J, Liedes O, Vara S, Melin M, et al. . Long-lasting T cell responses in BNT162b2 COVID-19 mRNA vaccinees and COVID-19 convalescent patients. Front Immunol (2022) 13. doi: 10.3389/fimmu.2022.869990 - DOI - PMC - PubMed
    1. Liu J, Chandrashekar A, Sellers D, Jacob-Dolan C, Lifton M, McMahan K, et al. . Vaccines elicit highly conserved cellular immunity to SARS-CoV-2 omicron. Nature (2022) 603:493–6. doi: 10.1038/s41586-022-04465-y - DOI - PMC - PubMed
    1. Goel RR, Painter MM, Apostolidis SA, Mathew D, Meng W, Rosenfeld AM, et al. . mRNA vaccines induce durable immune memory to SARS-CoV-2 and variants of concern. Science (2021) 374. doi: 10.1126/science.abm0829 - DOI - PMC - PubMed
    1. Agrati C, Castilletti C, Goletti D, Sacchi A, Bordoni V, Mariotti D, et al. . Persistent spike-specific T cell immunity despite antibody reduction after 3 months from SARS-CoV-2 BNT162b2-mRNA vaccine. Sci Rep (2022) 12. doi: 10.1038/s41598-022-07741-z - DOI - PMC - PubMed
    1. Khoury DS, Cromer D, Reynaldi A, Schlub TE, Wheatley AK, Juno JA, et al. . Neutralizing antibody levels are highly predictive of immune protection from symptomatic SARS-CoV-2 infection. Nat Med (2021) 27:1205–11. doi: 10.1038/s41591-021-01377-8 - DOI - PubMed

Publication types

Supplementary concepts

Grants and funding

This study was supported by the Academy of Finland (grant number 336410 to IJ and 339512 to LK), the Jane and Aatos Erkko Foundation (grant numbers 3067- 84b53 and 5360-cc2fc to IJ), the Sigrid Jusélius Foundation (to IJ and LK), and the Turku University Hospital Research Foundation (PT, LI, and JL).