. 2023 Feb 14;120(7):e2221036120.
doi: 10.1073/pnas.2221036120. Epub 2023 Feb 6.

Quantitative analysis of sterol-modulated monomer-dimer equilibrium of the β1-adrenergic receptor by DEER spectroscopy

Affiliations

Quantitative analysis of sterol-modulated monomer-dimer equilibrium of the β1-adrenergic receptor by DEER spectroscopy

Nina Kubatova et al. Proc Natl Acad Sci U S A. .

Abstract

G protein-coupled receptors (GPCR) activate numerous intracellular signaling pathways. The oligomerization properties of GPCRs, and hence their cellular functions, may be modulated by various components within the cell membrane (such as the presence of cholesterol). Modulation may occur directly via specific interaction with the GPCR or indirectly by affecting the physical properties of the membrane. Here, we use pulsed Q-band double electron-electron resonance (DEER) spectroscopy to probe distances between R1 nitroxide spin labels attached to Cys163 and Cys344 of the β1-adrenergic receptor (β1AR) in n-dodecyl-β-D-maltoside micelles upon titration with two soluble cholesterol analogs, cholesteryl hemisuccinate (CHS) and sodium cholate. The former, like cholesterol, inserts itself into the lipid membrane, parallel to the phospholipid chains; the latter is aligned parallel to the surface of membranes. Global quantitative analysis of DEER echo curves upon titration of spin-labeled β1AR with CHS and sodium cholate reveal the following: CHS binds specifically to the β1AR monomer at a site close to the Cys163-R1 spin label with an equilibrium dissociation constant [Formula: see text] ~1.4 ± 0.4 mM. While no direct binding of sodium cholate to the β1AR receptor was observed by DEER, sodium cholate induces specific β1AR dimerization ([Formula: see text] ~35 ± 6 mM and a Hill coefficient n ~ 2.5 ± 0.4) with intersubunit contacts between transmembrane helices 1 and 2 and helix 8. Analysis of the DEER data obtained upon the addition of CHS to the β1AR dimer in the presence of excess cholate results in dimer dissociation with species occupancies as predicted from the individual KD values.

Keywords: G protein-coupled receptor; cholesterol; dimerization; electron paramagnetic resonance; spin-labeling.


Conflict of interest statement

The authors declare no competing interest.

Figures

Fig. 1.
Fig. 1.
Chemical structure of cholesterol, CHS, and sodium cholate. Cholesterol and CHS comprise hydrophobic (gray) and hydrophilic (pink) regions that allow cholesterol and CHS to penetrate the lipid membrane, parallel to the phospholipid chains. Sodium cholate, on the other hand, has distinct, opposing polar (pink) and hydrophobic (gray) surfaces, such that sodium cholate aligns parallel to the membrane surface. The chemical structure and steric representation of sodium cholate are displayed on the top and bottom, respectively (18).
Fig. 2.
Fig. 2.
Q-band DEER measurements on R1-nitroxide spin-labeled β1AR (C163-R1/C344-R1) in DDM micelles. (A) Sterol-free, (B) CHS-bound, and (C) cholate/DDM micelles. The experimental DEER echo curves (Left) are shown in blue, and the corresponding best-fit curves obtained by Tikhonov regularization using the program DeerLab (37) are in red; the dashed black line represents the background. The P(r) distributions (Middle) derived from the experimental DEER data using validated Tikhonov regularization are shown in blue (with the light blue shading representing the upper and lower error estimates); the P(r) distributions calculated from the molecular coordinates (31) of the β1AR crystal structure [Protein Data Bank (PDB) 2Y00 (35)] using the calcPr helper function in Xplor-NIH (38) are displayed in red. The Right panels display the corresponding structures. The locations of the R1 nitroxide spin labels at Cys344-R1 and Cys163-R1 are shown as red spheres, and the CHS and HEGA-10 (2CV) molecules are shown as sticks. β1AR in the 2Y00 structure was crystallized with two CHS molecules: CHS1 is in close proximity to Cys163-R1 and is highlighted in lilac, while CHS2 is shown in blue. The cholate-induced dimer of β1AR was modeled using the monomer coordinates from the 2Y00 structure (35) placed in the dimer orientation observed in the 4GPO crystal structure (39). Note that in the P(r) distributions shown for the cholate-induced dimer in (C) (Middle), there is a small peak at ~23 Å present in both the structure-based simulated (red trace) and experimental DEER-derived (blue trace) P(r) distributions. The 23 Å peak in the experimental P(r) distribution obtained by Tikhonov regularization is likely due to overfitting since it is not consistently present over the course of the cholate titration (Fig. 3 and SI Appendix, Fig. S13) and the upper and lower confidence limits are large in relation to the peak height (see SI Appendix, Fig. S5 for a more detailed discussion). In the case of the simulated P(r) distribution, the 23 Å peak arises from one of the possible three positions of the C163-R1 nitroxide (Rightmost panel in C) (SI Appendix, Table S2).
Fig. 3.
Fig. 3.
Quantitative analysis of Q-band DEER data obtained for nitroxide spin-labeled β1AR (C163-R1/C344-R1) upon titration with CHS and cholate. (A) DEER echo curves recorded for ~60 μM β1AR (C163-R1/C344-R1) in DDM as a function of CHS concentration (Left panels: raw experimental data, blue; best-fit curves from global Gaussian modeling, red; background, black dashed lines) and corresponding P(r) distributions (Right) obtained either by validated Tikhonov regularization [blue, with upper and lower error estimates shown by the light blue shading (37)] or global Gaussian modeling with five Gaussians (31) in which peak positions and widths are treated as global parameters and the fractional population of the bound state is determined by the equilibrium dissociation constant KDCHS (red). (The complete titration dataset and analysis is provided in SI Appendix, Figs. S7–S10.) (B) Simple binding scheme of CHS to β1AR (Left) and fractional populations of the peaks in the P(r) distribution as a function of CHS concentration. The circles are the fractional populations obtained from the global four-Gaussian fits to the DEER data in which the peak positions and widths are treated as global parameters; the continuous lines are obtained from the global fit to the raw DEER data using a five-Gaussian model that, in addition, includes the concentration dependence of the fraction CHS-bound species (pbound) determined by the simple binding isotherm given by [(CHS)/ KDCHS]/[1 + (CHS)/ KDCHS], where KDCHS is the equilibrium dissociation constant. The decrease in the peak intensity at ~26 Å (shown in blue) is due to the disappearance of residual dimer (~9% in sterol-free β1AR) and occurs concomitantly with the binding of CHS. Note that the total area under the P(r) distribution is always normalized to 1 at every point in the titration. The reduced χ2 and global parameters of the fits (peak positions and widths, and KDCHS) are provided in Table 1. (C) DEER echo curves recorded for ~60 µM β1AR (C163-R1/C344-R1) in DDM as a function of cholate concentration (Left panels: raw experimental data, blue; best-fit curves from global Gaussian modeling, red; background, black dashed line) and corresponding P(r) distributions (Right) obtained either by validated Tikhonov regularization (blue, with upper and lower error estimates shown by the light blue shading) or global Gaussian modeling with five Gaussians in which peak positions and widths are treated as global parameters and the fractional population of dimer is determined by a cooperative dimerization model (red). (D) β1AR dimerization upon binding of cholate to DDM micelles (Left) and fractional populations of the peaks in the P(r) distribution as a function of cholate concentration. The circles are the fractional populations obtained from the global four-Gaussian fits to the DEER data in which the peak positions and widths are global parameters; the continuous lines are obtained from the global fit to the raw DEER data using a five-Gaussian model that, in addition, includes the concentration dependence of the fraction of dimeric species (pdimer) determined by the Hill equation given by pdimer0+1-pdimer0cholaten/{(KDcholate)n + cholaten}, where KDcholate is the equilibrium dissociation constant, n the Hill coefficient, and pdimer0 the fraction dimer in the absence of cholate. Note that the total area under the P(r) distribution is always normalized to 1 at every point in the titration. (The complete cholate titration dataset and analysis is provided in SI Appendix, Figs. S11–S13). The reduced χ2 and global parameters of the fits (peak positions and widths, and KDcholate and the Hill coefficient n) are provided in Table 2. Note that the fractional contribution of the peaks arising from intramolecular distances decreases over the course of the cholate titration; this is because the total area under the P(r) distribution is normalized to 1 at every point in the titration. A renormalized plot is shown in SI Appendix, Fig. S14, where the contribution from the intramolecular peaks is normalized to 1 and remains constant throughout the titration (since there are two intramolecular distances in the dimer, C163-R1–C344-R1 and C163’-R1–C344’-R1, corresponding to 1 in monomer units), and that from intersubunits peaks is normalized to 1.5 (since there are three intermolecular distances in the dimer, C344-R1–C344’-R1, C344-R1–C163’-R1, and C163-R1–C344’-R1, corresponding to 1.5 in monomer units).
Fig. 4.
Fig. 4.
Comparison of the residuals as a function of dipolar evolution time for the global Gaussian fits to the Q-band DEER titration data for CHS and cholate binding to spin-labeled β1AR (C163-R1/C344-R1)-DDM micelles versus the individual fits obtained by Tikhonov regularization. (A) CHS and (B) cholate titrations. The residuals for the global Gaussian fits (incorporating the concentration dependence of the CHS-bound and dimeric species) are shown in red, while those for the individual Tikhonov regularization fits are in blue. The concentration of β1AR is ~60 μM. The complete datasets are provided in SI Appendix, Figs. S7–S9 for the CHS titration, and SI Appendix, Figs. S11–S13 for the cholate titration. The reduced χ2 values for the fits to the CHS and cholate DEER titration data are provided in Tables 1 and 2, respectively.
Fig. 5.
Fig. 5.
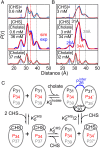
CHS dissociates the cholate-induced dimer of nitroxide spin-labeled β1AR (C163-R1/C344-R1). P(r) distance distributions obtained for spin-labeled β1AR (~50 μM) in DDM with (A) 0.6 mM and (B) 3 mM CHS in the presence of 34 to 36 mM cholate are shown in the Middle panels. For comparison the Top and Bottom panels show the P(r) distributions obtained in the presence of either CHS (Top) or cholate (Bottom). (C) Depiction of the equilibria involved in cholate-induced dimerization upon binding of cholate to DDM micelles and dimer dissociation by specific binding of CHS to β1AR. In panels A and B, the light blue (Top), blue (Middle, denoted as “exp”), and gray (Bottom) P(r) distributions are obtained from individual fits to the experimental DEER echo curves using Tikhonov regularization (37). The P(r) distributions depicted by the thin red lines in the Top and Bottom panels are obtained from global fits to the DEER titration data using the global five-Gaussian fits (31) incorporating the respective equilibria for CHS and cholate binding, respectively (see Fig. 3 and Tables 1 and 2). The P(r) distributions depicted by the thick red lines (denoted as “sim” in the Middle panels) are obtained from a population-weighted linear combination of the species in panel C with the fractional populations calculated using the values (Tables 1 and 2) of the equilibrium dissociation constants, and in the case of cholate-induced dimerization the Hill coefficient as well, determined from the global fits to the DEER titration data shown in Fig. 3. The small peaks below ~26 Å seen in some of the experimental P(r) distributions obtained by Tikhonov regularization arise from overfitting artefacts as their upper and lower confidence limits are large in relation to the corresponding peak heights.

Similar articles

Cited by

References

    1. Shimada I., Ueda T., Kofuku Y., Eddy M. T., Wuthrich K., GPCR drug discovery: Integrating solution NMR data with crystal and cryo-EM structures. Nat. Rev. Drug Discov. 18, 59–82 (2019). - PMC - PubMed
    1. Kolb P., et al. , Structure-based discovery of β2-adrenergic receptor ligands. Proc. Natl. Acad. Sci. U.S.A. 106, 6843–6848 (2009). - PMC - PubMed
    1. Shoichet B. K., Kobilka B. K., Structure-based drug screening for G-protein-coupled receptors. Trends Pharmacol. Sci. 33, 268–272 (2012). - PMC - PubMed
    1. Wisler J. W., Rockman H. A., Lefkowitz R. J., Biased G Protein-coupled receptor signaling: Changing the paradigm of drug discovery. Circulation 137, 2315–2317 (2018). - PMC - PubMed
    1. Rosenbaum D. M., Rasmussen S. G., Kobilka B. K., The structure and function of G-protein-coupled receptors. Nature 459, 356–363 (2009). - PMC - PubMed

Publication types