. 2023 Feb 6;19(2):e1011156.
doi: 10.1371/journal.ppat.1011156. eCollection 2023 Feb.

The APOBEC3B cytidine deaminase is an adenovirus restriction factor

Affiliations

The APOBEC3B cytidine deaminase is an adenovirus restriction factor

Noémie Lejeune et al. PLoS Pathog. .

Abstract

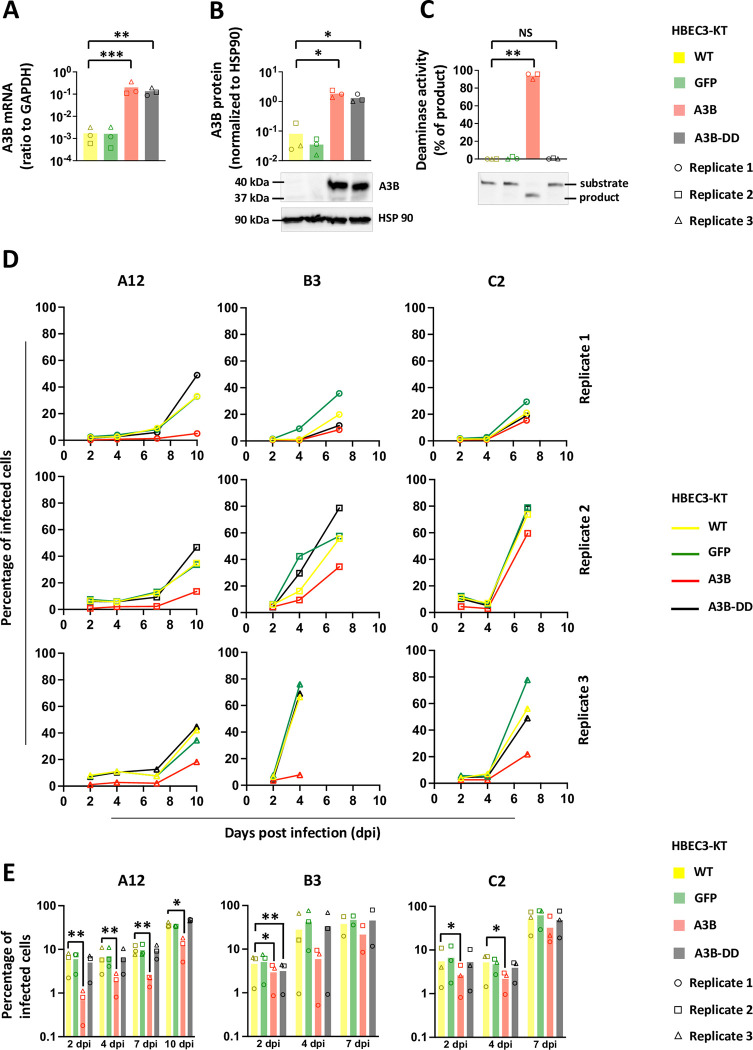
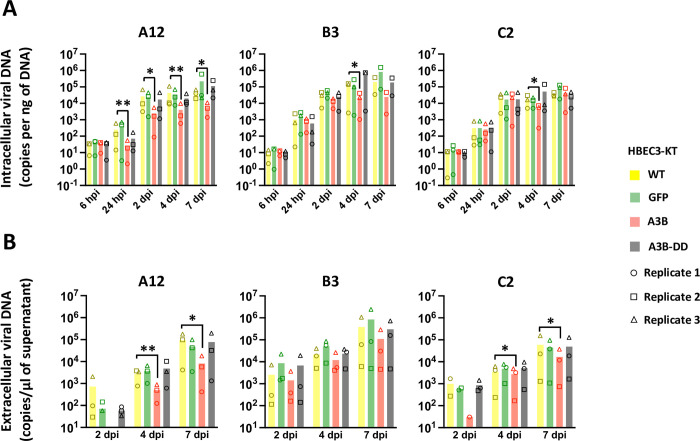
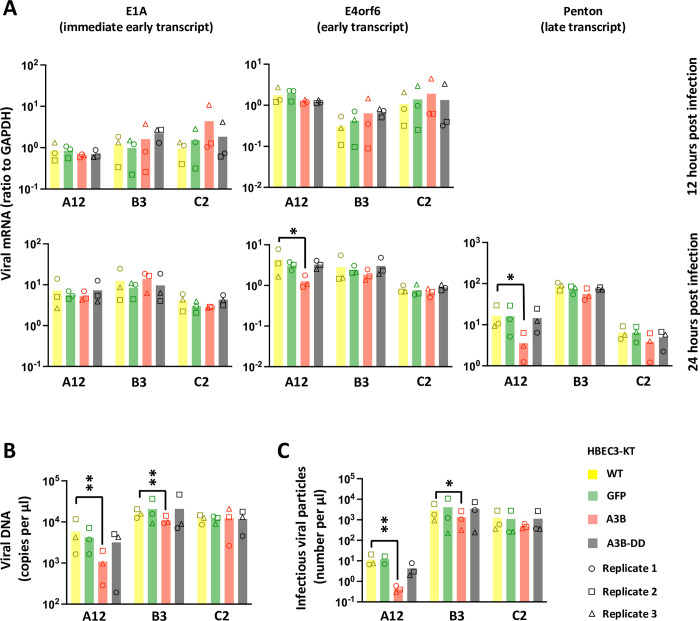
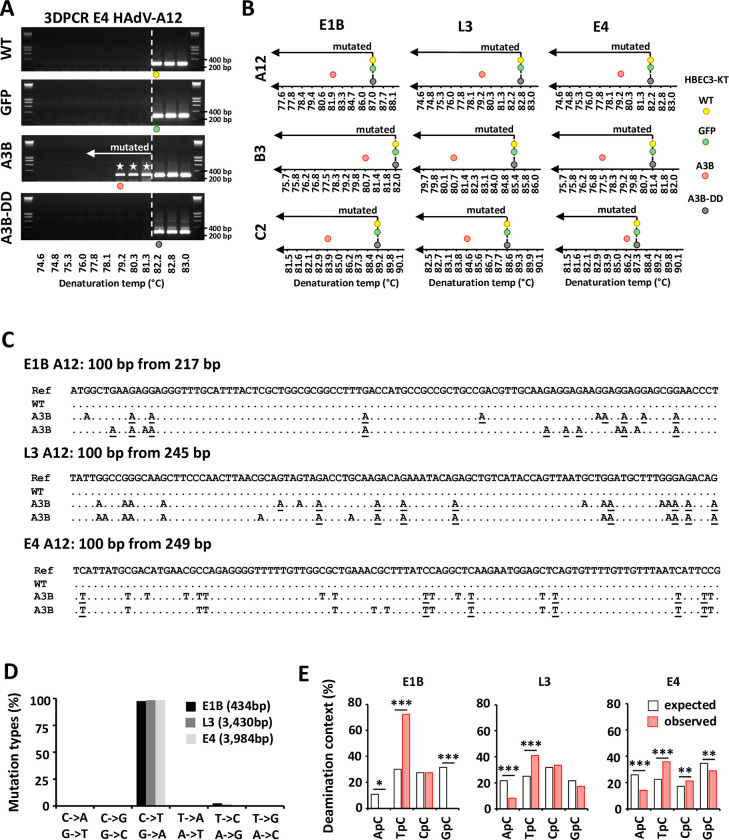
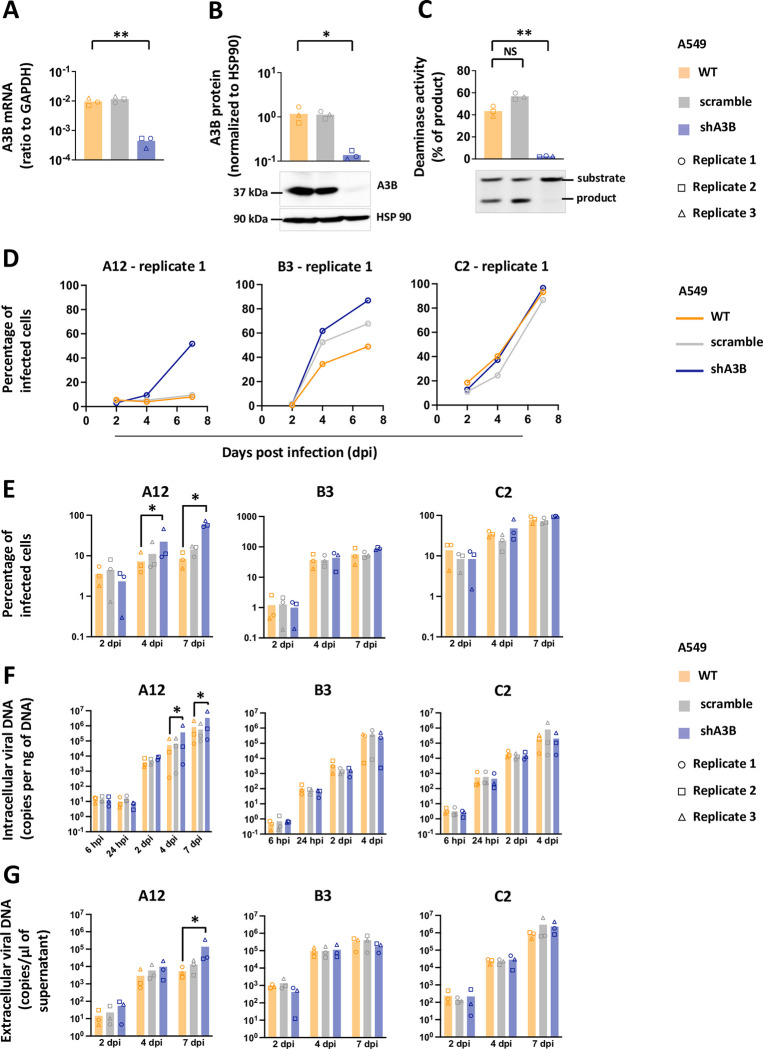
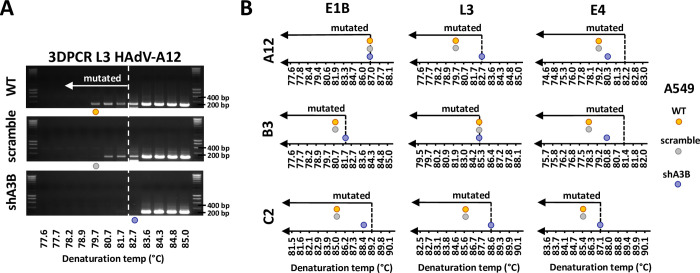
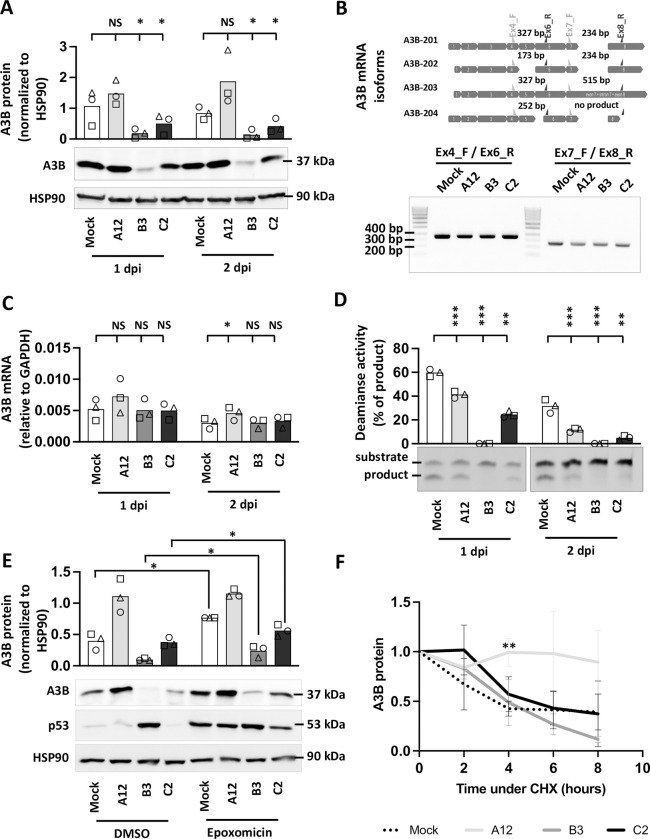
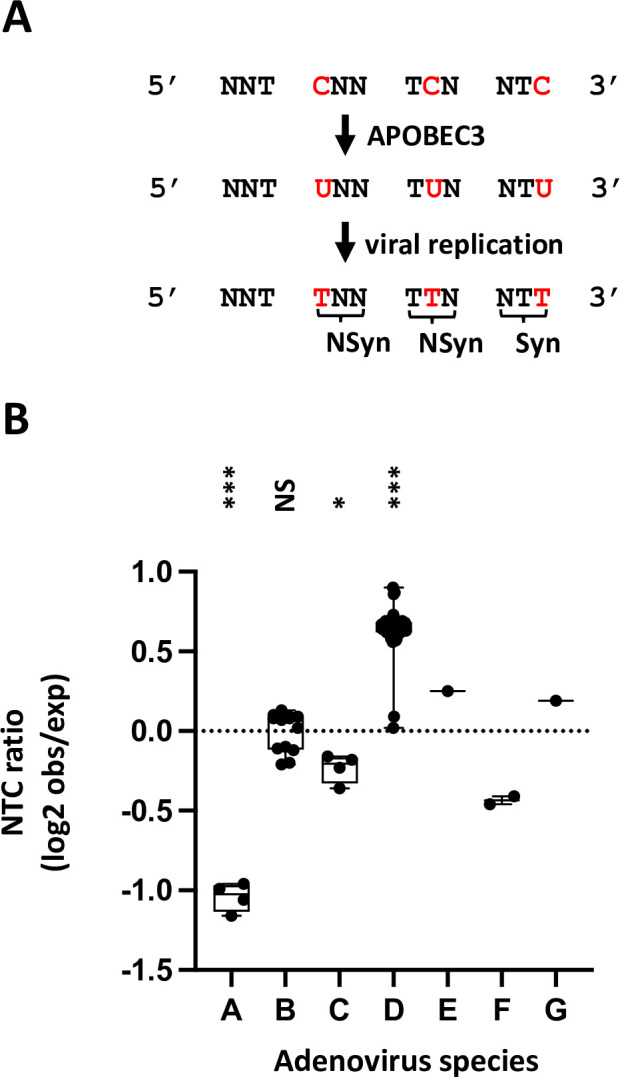
Human adenoviruses (HAdVs) are a large family of DNA viruses counting more than a hundred strains divided into seven species (A to G). HAdVs induce respiratory tract infections, gastroenteritis and conjunctivitis. APOBEC3B is a cytidine deaminase that restricts several DNA viruses. APOBEC3B is also implicated in numerous cancers where it is responsible for the introduction of clustered mutations into the cellular genome. In this study, we demonstrate that APOBEC3B is an adenovirus restriction factor acting through a deaminase-dependent mechanism. APOBEC3B introduces C-to-T clustered mutations into the adenovirus genome. APOBEC3B reduces the propagation of adenoviruses by limiting viral genome replication, progression to late phase, and production of infectious virions. APOBEC3B restriction efficiency varies between adenoviral strains, the A12 strain being more sensitive to APOBEC3B than the B3 or C2 strains. In A12-infected cells, APOBEC3B clusters in the viral replication centers. Importantly, we show that adenovirus infection leads to a reduction of the quantity and/or enzymatic activity of the APOBEC3B protein depending on the strains. The A12 strain seems less able to resist APOBEC3B than the B3 or C2 strains, a characteristic which could explain the strong depletion of the APOBEC3-targeted motifs in the A12 genome. These findings suggest that adenoviruses evolved different mechanisms to antagonize APOBEC3B. Elucidating these mechanisms could benefit the design of cancer treatments. This study also identifies adenoviruses as triggers of the APOBEC3B-mediated innate response. The involvement of certain adenoviral strains in the genesis of the APOBEC3 mutational signature observed in tumors deserves further study.


Conflict of interest statement

The authors have declared that no competing interests exist.

Figures

Fig 1
Fig 1. A3B slows down adenovirus propagation by a deaminase-dependent mechanism.
Immortalized human bronchial epithelial cells HBEC3-KT were transduced to stably express the GFP, the APOBEC3B protein (A3B) or a catalytically inactive version of the APOBEC3B protein (A3B-DD for Deaminase Dead). (A) A3B mRNA levels were quantified by RTqPCR and expressed relative to GAPDH mRNA level. (B) A3B protein levels were assessed by western blot, quantified by densitometry and normalized with HSP90. (C) Total proteins were extracted in a non-denaturing buffer and mixed with the substrate of the deamination assay. Deaminase activity, if present in the cell lysate, will allow the conversion of substrates into shorter products. Substrates and products were quantified by densitometry. Deamination activities of the cell lysates were expressed as the percentage of substrate converted into product. P-values were calculated by t-tests. (D-E) HBEC-WT, -GFP, -A3B and -A3B-DD were infected with HAdV-A12, -B3 or -C2 at a MOI = 0.03. The percentage of infected cells were quantified by flow cytometry at different time points post infection. The results of the 3 biological replicates are shown separately (D) or pooled together (E). P-values were calculated by ratio t-tests. Only significant differences are shown.
Fig 2
Fig 2. A3B slows down viral DNA production.
HBEC-WT, -GFP, -A3B and -A3B-DD were infected with HAdV-A12, -B3 or -C2 at a MOI = 0.03. Intracellular viral DNA levels (A) and extracellular viral DNA levels (B) were quantified by qPCR at different time points post infection. P-values were calculated by ratio t-tests. Only significant differences are shown.
Fig 3
Fig 3. A3B reduces viral load, progression to late phase transcription, and production of infectious viral particles with variable efficacy between viral strains.
HBEC-WT, -GFP, -A3B and -A3B-DD were infected with HAdV-A12, -B3 or -C2 at a MOI = 3. (A) The levels of different viral mRNAs were quantified by RTqPCR after 12 and 24-hours post infection. An immediate early transcript (E1A), an early transcript (E4orf6) and a late transcript (Penton) were quantified. The penton mRNA could not be reliably detected at 12-hours post infection. (B) The levels of viral DNA were quantified by qPCR at 24 hours post infection. (C) The levels of infectious viral particles were quantified by foci forming assay at 24 hours post infection. P-values were calculated by ratio t-tests. Only significant differences are shown.
Fig 4
Fig 4. A3B introduces strand-coordinated C to T clustered mutations in the adenovirus genomes.
HBEC-WT, -GFP, -A3B and -A3B-DD were infected with HAdV-A12, -B3 or -C2 and the intracellular DNA was extracted 48 hours post infection. 3DPCR reactions were conducted on the E1B, L3 and E4 genes. (A) Agarose gels illustrating 3DPCR reactions specific for the E4 gene of the A12 strain are shown. The dotted white line indicates the threshold between mutated and unmutated 3DPCR products. Low denaturation temperature amplicons were recovered in HBEC-A3B cells only. (B) Graphical representation of the 3DPCR results obtained for the 3 viral genes (E1B, L3 and E4), for the 3 viral strains (A12, B3 and C2) and for the 4 cell lines (WT, GFP, A3B and A3B-DD). The lowest denaturation temperatures allowing the production of the expected amplicons were represented on the gradients by colored circles. (C) 3DPCR products generated from HAdV-A12-infected WT and A3B-expressing cells were cloned and sequenced. Hypermutated sequences detected in A3B-expressing cells (A3B) were aligned against the reference viral genome (Ref) and against sequences isolated from WT infected cells (WT). Deamination occurred on the coding (C to T mutations) or the template strand (G to A mutations of the coding strand). The mutations underlined took place within an A3-favored motif with a T in 5’ of the deaminated C. (D) Mutation types recorded on the E1B, L3 and E4 hypermutated sequences. The numbers in brackets indicate the number of bases sequenced. (E) 5’ nucleotide contexts of the deaminated Cs recorded on the E1B, L3 and E4 hypermutated sequences were reported by red bars. 5’ nucleotide context expected values, based on the dinucleotide composition of the DNA sequences were represented by white bars. P-values were calculated by χ2-tests.
Fig 5
Fig 5. A3B knockdown promotes replication of strain A12.
A549 lung cancer cells were transduced to stably express APOBEC3B-targeting shRNAs (shA3B) or a nontargeting control shRNA (scramble). (A) A3B mRNA levels were quantified by RTqPCR and expressed relative to GAPDH mRNA. (B) A3B protein levels were assessed by western blot, quantified by densitometry and normalized with HSP90. (C) Deamination activities of the cell lysates were expressed as the percentage of substrate converted into product and compared to the deamination activity of the WT cells. P-values were calculated by t-tests. (D-G) A549-WT, -scramble and -shA3B were infected with HAdV-A12, -B3 or -C2 at a MOI = 0.03 and analyzed at different time points post infection. (D-E) The percentage of infected cells were quantified by flow cytometry. The results of the first replicate are shown in panel D and the data from the 3 replicates are shown in panel E. Intracellular viral DNA levels (F) and extracellular viral DNA levels (G) were quantified by qPCR. P-values were calculated by ratio t-tests. Only significant differences are shown.
Fig 6
Fig 6. A3B knockout reduces the presence of hypermutated viral sequences.
A549-WT, -scramble and -shA3B were infected with HAdV-A12, -B3 or -C2 and the intracellular DNA was extracted 48 hours post infection. 3DPCR reactions were conducted on the E1B, L3 and E4 genes. (A) Agarose gels illustrating 3DPCR specific for the L3 gene of the A12 strain. The dotted white line indicates the threshold between mutated and unmutated 3DPCR products. Low denaturation temperature amplicons were recovered in WT and scramble A549 cells. (B) Graphical representation of the 3DPCR results obtained for the 3 viral genes (E1B, L3 and E4), for the 3 viral strains (A12, B3 and C2) and for the 3 cell lines (WT, scramble and shA3B). The lowest denaturation temperatures allowing the production of the expected amplicons were represented on the gradients by colored circles.
Fig 7
Fig 7. Adenovirus infection reduces A3B quantity and/or enzymatic activity depending on the viral strain.
A549 cells were infected with HAdV-A12, -B3, -C2 or mock control at a MOI = 3. (A) A3B protein levels were assessed by western blot at 1- and 2-days post infection, quantified by densitometry and normalized with HSP90. (B) A3B mRNA isoforms were detected by discriminative RT-PCR reactions at 2-days post infection. (C) A3B mRNA levels were quantified by RTqPCR at 1- and 2-days post infection and expressed relative to GAPDH mRNA. (D) Deamination activities of the cell lysates were expressed as the percentage of substrate converted into product and compared to the deamination activities of the mock-infected cells at 1- and 2-days post infection. P-values were calculated by ratio t-tests. (E) Epoxomicin was added at 16 hpi. Six hours later, A3B, p53 and HPS90 protein levels were assessed by western blot. P-values were calculated by paired t-tests. (F) Cycloheximide was added at 16 hpi. The levels of A3B, p53 and HPS90 proteins were evaluated by western blot for a period of 8 hours and expressed relative to the level measured just before the addition of cycloheximide. P-values were calculated by t-tests (infected conditions compared to mock). Error bars show standard deviation.
Fig 8
Fig 8. A3B recolocalizes inside the viral replication centers in A12-infected cells.
A549 cells were infected with HAdV-A12, -B3, -C2 or mock control at a MOI = 3. B3- and C2-infected cells were analyzed 20 hours post infection and A12-infected cells were analyzed 24 hours post infection. (A) The A3B protein (green) and the viral replication centers as identified by EdU labelling (red) were imaged by fluorescence microscopy. (B) A3B labelling was quantified within the EdU+ area. Each circle represents a given cell. The yellow-colored circles correspond to the images shown in panel A. P-values were calculated by unpaired t-tests. (C) Colocalization between A3B and EdU labeling in A12-infected cells was estimated using Manders’ coefficients.
Fig 9
Fig 9. Adenoviruses of the species A display a significant APOBEC3 evolutionary footprint.
(A) The A3s induce C-to-U deamination preferentially in a 5’TC dinucleotide context. After viral replication the mutation is conserved in the viral genome as a C to T transition (in red). Depending on the position of the TC motif in codon, the mutation is synonymous (Syn) or non-synonymous (NSyn). Since synonymous mutations are more likely to be conserved, the APOBEC3 footprint is defined as the depletion of the NTC codon. (B) The NTC codon observed/expected ratios were calculated in 70 different adenoviruses spanning the 7 species. P-values were calculated by t-tests.

Similar articles

Cited by

References

    1. Lion T. Adenovirus Infections in Immunocompetent and Immunocompromised Patients. Clin Microbiol Rev. 2014;27: 441–462. doi: 10.1128/CMR.00116-13 - DOI - PMC - PubMed
    1. Seto D, Chodosh J, Brister JR, Jones MS. Using the Whole-Genome Sequence To Characterize and Name Human Adenoviruses▿. J Virol. 2011;85: 5701–5702. doi: 10.1128/JVI.00354-11 - DOI - PMC - PubMed
    1. Lynch J, Kajon A. Adenovirus: Epidemiology, Global Spread of Novel Serotypes, and Advances in Treatment and Prevention. Semin Respir Crit Care Med. 2016;37: 586–602. doi: 10.1055/s-0036-1584923 - DOI - PMC - PubMed
    1. Binder AM. Human Adenovirus Surveillance—United States, 2003–2016. MMWR Morb Mortal Wkly Rep. 2017;66. doi: 10.15585/mmwr.mm6639a2 - DOI - PMC - PubMed
    1. Pecori R, Di Giorgio S, Paulo Lorenzo J, Nina Papavasiliou F. Functions and consequences of AID/APOBEC-mediated DNA and RNA deamination. Nat Rev Genet. 2022. doi: 10.1038/s41576-022-00459-8 - DOI - PMC - PubMed

Publication types

Grants and funding

This study was supported by FRS-FNRS grant CDR n°31270116 and n°40007814 and by the University of Namur. NL is a PhD fellow supported by FRIA grant n°31454280. SM is a PhD fellow supported by FRIA grant n°40008651. FP is a PhD fellow supported by Télévie grant PDR-TLV n°34972507. AD is a PhD fellow supported by an FSR grant co-founded between University of Namur (Belgium) and University of Mons (Belgium). KAR is supported by the Allocation de Recherche du Ministère français de la Recherche. The funders had no role in study design, data collection and interpretation, or the decision to submit the work for publication.