. 2023 Jan 19:13:1081237.
doi: 10.3389/fmicb.2022.1081237. eCollection 2022.

Long non-coding RNA SNHG9 regulates viral replication in rhabdomyosarcoma cells infected with enterovirus D68 via miR-150-5p/c-Fos axis

Affiliations

Long non-coding RNA SNHG9 regulates viral replication in rhabdomyosarcoma cells infected with enterovirus D68 via miR-150-5p/c-Fos axis

Huichao Fu et al. Front Microbiol. .

Abstract

Background: The Enterovirus D68 (EV-D68) epidemic has increased knowledge of the virus as a pathogen capable of causing serious respiratory and neurological illnesses. It has been shown that long noncoding RNAs (lncRNAs) regulate viral replication and infection via multiple mechanisms or signaling pathways. However, the precise function of lncRNAs in EV-D68 infection remains unknown.

Methods: The differential expression profiles of lncRNA in EV-D68-infected and uninfected rhabdomyosarcoma (RD) cells were studied using high-throughput sequencing technology. The knockdown through small interfering RNA (siRNA) and overexpression of lncRNA SNHG9 (small ribonucleic acid host gene 9) were applied to investigate how lncRNA SNHG9 regulates EV-D68 propagation. The targeted interactions of lncRNA SNHG9 with miR-150-5p and miR-150-5p with c-Fos were validated using dual luciferase reporter system. LncRNA SNHG9 knockdown and miR-150-5p inhibitor were co-transfected with RD cells. QRT-PCR and western blot were used to detect RNA and protein levels, of c-Fos and VP1, respectively. Median tissue culture infectious dose (TCID50) was applied to detect viral titers.

Results: The results demonstrated that a total of 375 lncRNAs were highly dysregulated in the EV-D68 infection model. In the EV-D68 infection model, lncRNA SNHG9 and c-Fos were increased in EV-D68-infected RD cells. However, the expression level of miR-150-5p was downregulated. In addition, overexpression of SNHG9 in RD cells resulted in decreased viral replication levels and viral titers following infection with EV-D68, and further experiments revealed that overexpression of SNHG9 inhibited the viral replication by targeting increased miR-150-5p binding and significantly increased c-Fos expression in RD cells.

Conclusion: Our findings indicate that the SNHG9/miR-150-5p/c-Fos axis influences EV-D68 replication in host cells and that SNHG9 may be a possible target for anti-EV-D68 infection therapies.

Keywords: SNHG9; c-Fos; ceRNA; enterovirus D68; infection; miR-150-5p.


Conflict of interest statement

The authors declare that the research was conducted in the absence of any commercial or financial relationships that could be construed as a potential conflict of interest.

Figures

Figure 1
Figure 1
Construction of EV-D68 infected cell model. (A) The relative expression level of viral VP1 was determined using quantitative reverse transcription polymerase chain reaction (qRT-PCR). Rhabdomyosarcoma (RD) cells were infected with EV-D68 for 0, 6, 12, 18, and 24 h respectively, and the total RNA was extracted. (B) The expression level of viral VP1 was determined by western blot. The total protein in RD cells was collected, which had been infected with EV-D68 for 0, 6, 12, 18, and 24 h, respectively (**p < 0.01, ****p < 0.0001).
Figure 2
Figure 2
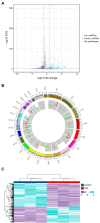
Differential analysis of lncRNA expression profiles. (A) Differential lncRNAs volcano plot: the plot’s horizontal and vertical axes reflect Log2(Fold change) and -Log10(Q. Value), respectively. We determined the importance of Log2 | (Fold change) | ≥ 1, Q. Value < 0.05 as the cut-off criterion. (B) Localization of differential lncRNAs chromosomes: the inner and outer circles of the circos plot were used to represent up-regulated and down-regulated genes, respectively, with |Log2(Fold change) | ≥ 1, Q. Value < 0.05 as the cut-off criterion and the fold change in expression was represented by column height. (C) Heat map of expressed lncRNAs cluster analysis: each column represents control and experimental groups The horizontal axis symbolizes each column of experimental groups. The hue indicates the expression level of each sample group. The tint transitions from violet to blue as the level of expression increases.
Figure 3
Figure 3
Prediction of differential lncRNAs regulation. (A) Differential regulatory network for ceRNAs centered on lncRNAs: This diagram depicts lncRNAs, miRNAs, and mRNAs as squares, circles, and triangles, respectively. Red and dark blue denote the up- and down-regulated lncRNAs, respectively. (B) The co-expression network of lncRNAs and protein-coding genes is constructed in Cytoscape by employing Pearson correlation coefficients. The dots and diamonds indicate lncRNA and mRNA, respectively. (C) Triangles and squares, representing mRNAs and lncRNAs, respectively, depict anticipated up- and down-regulated differential fold top five lncRNAs and targeting relationships of all differential mRNAs, along with all reciprocal pairs predicted to have targeting associations. (D) Network regulation of interactions between lncRNAs and RNA-binding proteins: all potential target proteins of the top five predicted up- and down-regulated differential fold lncRNAs, and all predicted pairs of interactions with targeting relationships, with rectangular and square nodes representing mRNA and lncRNA, respectively.
Figure 4
Figure 4
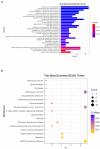
Enrichment evaluation (A) GO enrichment: the graph depicts the ranking of the most enriched pathways, with the number of genes enriched in each GO annotation represented by the horizontal bar and the size of Log10 (p. value) reflected by the bar’s color. (B) Enrichment of Kyoto Encyclopedia of Genes and Genomes (KEGG) signaling pathways: The size of the bubbles in the graph represents the number of genes enriched in each signaling route, while the color of the spots indicates their significance level.
Figure 5
Figure 5
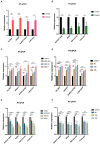
Validation of sequencing data by qRT-PCR (A,B) qRT-PCR validation of the screened up-and down-regulated genes, establishing the control group (MOI = 0) and the infected group (MOI = 1). (C,D) qRT-PCR was performed to verify the expression variations of up-regulated genes in RD cells after infection with EV-D68 at concentration gradients (MOI = 0.01, 0.1, 1) for 24 h and time gradients (6 h,12 h,18 h post-infection), MOI = 1. (E,F) qRT-PCR was used to verify the RNA levels of down-regulated genes at the concentration gradient and time gradient, respectively (*p < 0.05, **p < 0.01, ***p < 0.001, ****p < 0.0001).
Figure 6
Figure 6
LncRNA SNHG9/miR-150-5p/c-Fos axis validation (A) qRT-PCR was utilized to determine the expression of SNHG9, miR-150-5p, and c-Fos in RD cells. RD cells were transfected with miR-150-5p mimic and inhibitor and then infected with EV-D68 for 24 h. (B–D) qRT-PCR for validation of RNA levels of SNHG9, miR-150-5p, VP1, and c-Fos in RD cells (*p < 0.05, **p < 0.01, ***p < 0.001, ****p < 0.0001). (E) Viral titer assay for verification of viral replication levels. The data are expressed as mean standard deviation (n = 3) *p < 0.05, **p < 0.01, ***p < 0.001 in comparison to the mimic NC and inhibitor NC groups.
Figure 7
Figure 7
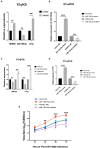
Effect of SNHG9 on viral replication in EV-D68-infected RD cells. RD cells were transfected with SNHG9-overexpression plasmid or si-SNHG9 and then infected with EV-D68 for 12 h. (A,B) Expression of SNHG9 and VP1 in RD cells was detected by qRT-PCR (*p < 0.05, **p < 0.01, ***p < 0.001, ****p < 0.0001). (C,D) Western blot was utilized to evaluate viral VP1 protein levels. The data are expressed as mean ± SD (n = 3) *p < 0.05, **p < 0.01, and ***p < 0.001 vs. the control, vector, and si-NC groups. (E) For the replication levels of viral infections, viral titers were estimated. The data are expressed as mean standard deviation (n = 3) *p < 0.05, **p < 0.01, ***p < 0.001 in comparison to the vector and si-NC groups.
Figure 8
Figure 8
SNHG9 regulates viral replication during EV-D68 infection of RD cells via the miR-150-5p/c-Fos axis. RD cells were transfected with SNHG9-overexpression plasmid or si-SNHG9 and then infected with EV-D68 for 12 h. (A,B) The expression of miR-150-5p and c-Fos in RD cells was detected by qRT-PCR (**p < 0.01, ***p < 0.001). (C,D) Western blot was utilized to evaluate viral c-Fos protein levels. The data are expressed as mean ± SD (n = 3) *p < 0.05, **p < 0.01, and ***p < 0.001 vs. the control, vector, and si-NC groups. (E) The binding sites for miR-150-5p in the SNHG9/c-Fos sequence were shown. (F) The interaction between miR-150-5p and SNHG9/c-Fos was verified by a dual luciferase reporter assay. RD cells were transfected with si-SNHG9 or conjugated with miR-150-5p inhibitor, and then infected with EV-D68 for 12 h. (G,H) Detection of viral VP1 and c-Fos expression in RD cells by qRT-PCR. (I,J) The protein levels of c-Fos and VP1 in RD cells were evaluated by western blot assay. Data are expressed as mean ± SD (n = 3). *p < 0.05, **p < 0.01, ***p < 0.001 vs. the indicated group.

Similar articles

Cited by

References

    1. Andrés C., Vila J., Creus-Costa A., Piñana M., González-Sánchez A., Esperalba J., et al. . (2022). Enterovirus D68 in hospitalized children, Barcelona, Spain, 2014-2021. Emerg. Infect. Dis. 28, 1327–1331. doi: 10.3201/eid2807.220264, PMID: - DOI - PMC - PubMed
    1. Aznaourova M., Schmerer N., Janga H., Zhang Z., Pauck K., Bushe J., et al. . (2022). Single-cell RNA sequencing uncovers the nuclear decoy lincRNA PIRAT as a regulator of systemic monocyte immunity during COVID-19. Proc. Natl. Acad. Sci. U. S. A. 119:e2120680119. doi: 10.1073/pnas.2120680119, PMID: - DOI - PMC - PubMed
    1. Basavappa M., Ferretti M., Dittmar M., Stoute J., Sullivan M., Whig K., et al. . (2022). The lncRNA ALPHA specifically targets chikungunya virus to control infection. Mol. Cell 82, 3729–3744.e10. doi: 10.1016/j.molcel.2022.08.030, PMID: - DOI - PMC - PubMed
    1. Bosis S., Esposito S. (2017). Enterovirus D68-associated community-acquired pneumonia in the pediatric age group. Curr. Infect. Dis. Rep. 19:12. doi: 10.1007/s11908-017-0567-8, PMID: - DOI - PubMed
    1. Cao H., Wahlestedt C., Kapranov P. (2018). Strategies to annotate and characterize long noncoding RNAs: advantages and pitfalls. Trends Genet. 34, 704–721. doi: 10.1016/j.tig.2018.06.002, PMID: - DOI - PubMed