Multimodal human thymic profiling reveals trajectories and cellular milieu for T agonist selection
- PMID: 36741401
- PMCID: PMC9895842
- DOI: 10.3389/fimmu.2022.1092028
Multimodal human thymic profiling reveals trajectories and cellular milieu for T agonist selection
Abstract
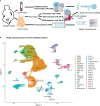
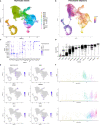
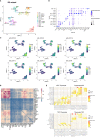
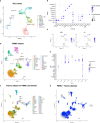
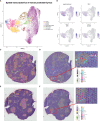
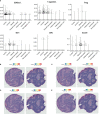
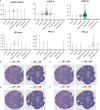
To prevent autoimmunity, thymocytes expressing self-reactive T cell receptors (TCRs) are negatively selected, however, divergence into tolerogenic, agonist selected lineages represent an alternative fate. As thymocyte development, selection, and lineage choices are dependent on spatial context and cell-to-cell interactions, we have performed Cellular Indexing of Transcriptomes and Epitopes by sequencing (CITE-seq) and spatial transcriptomics on paediatric human thymus. Thymocytes expressing markers of strong TCR signalling diverged from the conventional developmental trajectory prior to CD4+ or CD8+ lineage commitment, while markers of different agonist selected T cell populations (CD8αα(I), CD8αα(II), T(agonist), Treg(diff), and Treg) exhibited variable timing of induction. Expression profiles of chemokines and co-stimulatory molecules, together with spatial localisation, supported that dendritic cells, B cells, and stromal cells contribute to agonist selection, with different subsets influencing thymocytes at specific developmental stages within distinct spatial niches. Understanding factors influencing agonist T cells is needed to benefit from their immunoregulatory effects in clinical use.
Keywords: T agonist selection; T cell development; antigen-presenting cells; autoimmunity; human thymus; multi-modal; single-cell RNA sequencing; spatial transcriptomics.
Copyright © 2023 Heimli, Flåm, Hjorthaug, Trinh, Frisk, Dumont, Ribarska, Tekpli, Saare and Lie.
Conflict of interest statement
TR was employed by the company Exact Sciences Innovation Ltd. The remaining authors declare that the research was conducted in the absence of any commercial or financial relationships that could be construed as a potential conflict of interest.
Figures


Similar articles
-
A signal integration model of thymic selection and natural regulatory T cell commitment.J Immunol. 2014 Dec 15;193(12):5983-96. doi: 10.4049/jimmunol.1400889. Epub 2014 Nov 12. J Immunol. 2014. PMID: 25392533
-
Human thymic putative CD8αα precursors exhibit a biased TCR repertoire in single cell AIRR-seq.Sci Rep. 2023 Oct 18;13(1):17714. doi: 10.1038/s41598-023-44693-4. Sci Rep. 2023. PMID: 37853083 Free PMC article.
-
Increased TCR signal strength in DN thymocytes promotes development of gut TCRαβ(+)CD8αα(+) intraepithelial lymphocytes.Sci Rep. 2017 Sep 6;7(1):10659. doi: 10.1038/s41598-017-09368-x. Sci Rep. 2017. PMID: 28878277 Free PMC article.
-
Thymic microenvironments for T-cell repertoire formation.Adv Immunol. 2008;99:59-94. doi: 10.1016/S0065-2776(08)00603-2. Adv Immunol. 2008. PMID: 19117532 Review.
-
Thymocyte selection: not by TCR alone.Immunol Rev. 1998 Oct;165:209-29. doi: 10.1111/j.1600-065x.1998.tb01241.x. Immunol Rev. 1998. PMID: 9850863 Review.
Cited by
-
Decoding mutational hotspots in human disease through the gene modules governing thymic regulatory T cells.Front Immunol. 2024 Oct 15;15:1458581. doi: 10.3389/fimmu.2024.1458581. eCollection 2024. Front Immunol. 2024. PMID: 39483472 Free PMC article.
-
STimage-1K4M: A histopathology image-gene expression dataset for spatial transcriptomics.ArXiv [Preprint]. 2024 Jun 20:arXiv:2406.06393v2. ArXiv. 2024. PMID: 38947920 Free PMC article. Preprint.
-
Developmental trajectory of unconventional T cells of the cynomolgus macaque thymus.Heliyon. 2024 Oct 23;10(21):e39736. doi: 10.1016/j.heliyon.2024.e39736. eCollection 2024 Nov 15. Heliyon. 2024. PMID: 39524802 Free PMC article.
-
A spatial human thymus cell atlas mapped to a continuous tissue axis.Nature. 2024 Nov;635(8039):708-718. doi: 10.1038/s41586-024-07944-6. Epub 2024 Nov 20. Nature. 2024. PMID: 39567784 Free PMC article.
-
Rediscovering the human thymus through cutting-edge technologies.J Exp Med. 2024 Oct 7;221(10):e20230892. doi: 10.1084/jem.20230892. Epub 2024 Aug 21. J Exp Med. 2024. PMID: 39167072 Free PMC article. Review.
References
Publication types
MeSH terms
Substances
Grants and funding
LinkOut - more resources
Full Text Sources
Research Materials

