. 2023 Feb 3;14(1):583.
doi: 10.1038/s41467-023-36311-8.

Alternative polyadenylation transcriptome-wide association study identifies APA-linked susceptibility genes in brain disorders

Affiliations

Alternative polyadenylation transcriptome-wide association study identifies APA-linked susceptibility genes in brain disorders

Ya Cui et al. Nat Commun. .

Abstract

Alternative polyadenylation (APA) plays an essential role in brain development; however, current transcriptome-wide association studies (TWAS) largely overlook APA in nominating susceptibility genes. Here, we performed a 3' untranslated region (3'UTR) APA TWAS (3'aTWAS) for 11 brain disorders by combining their genome-wide association studies data with 17,300 RNA-seq samples across 2,937 individuals. We identified 354 3'aTWAS-significant genes, including known APA-linked risk genes, such as SNCA in Parkinson's disease. Among these 354 genes, ~57% are not significant in traditional expression- and splicing-TWAS studies, since APA may regulate the translation, localization and protein-protein interaction of the target genes independent of mRNA level expression or splicing. Furthermore, we discovered ATXN3 as a 3'aTWAS-significant gene for amyotrophic lateral sclerosis, and its modulation substantially impacted pathological hallmarks of amyotrophic lateral sclerosis in vitro. Together, 3'aTWAS is a powerful strategy to nominate important APA-linked brain disorder susceptibility genes, most of which are largely overlooked by conventional expression and splicing analyses.


Conflict of interest statement

The authors declare no competing interests.

Figures

Fig. 1
Fig. 1. Overview of this study.
a RNA-seq and matched genotype data were collected from the GTEx, ROS/MAP, and PsychENCODE cohorts as reference panels. We then performed 3′aQTL analysis and built 3′aTWAS models to predict the APA usage of target genes with cis-SNPs in the reference panels. b We performed 3′aTWAS analysis to nominate susceptibility genes in brain disorders using GWAS summary statistics and 3′aTWAS models in each reference panel. c APA-linked susceptibility genes in brain disorders identified by 3′aTWAS, which confirmed two previously validated risk APA genes (SNCA and DDHD2). This schematic was created with BioRender.
Fig. 2
Fig. 2. 3′aQTLs explain a large portion of brain disorder heritability.
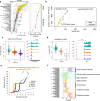
a PDUI values of 49 GTEx tissues show that transcripts expressed in the brain tissues have longer 3′UTRs than non-brain tissues. The left panel is the PDUI of an example gene CD47 (n = 15,201 RNA-seq samples). The right panel shows the mean PDUI values for all genes. A higher PDUI value corresponds with longer 3′UTR usage. The color of each tissue corresponds with those used in the GTEx cohort. The center horizontal lines within the plot represent the median values and the boxes are bounded by the 25th and 75th percentile. The whiskers extend to the maximum and minimum values within 1.5 times of the interquartile range. b The number of 3′aQTL APA events highly correlates with the sample size in each tissue. Each dot indicates a tissue type. Yellow and gray dots indicate brain and non-brain tissue types, respectively. c Example of a SNP (rs4241814) that is strongly associated with FAM149A 3′UTR usage in the brain. Left panel: Distribution of the normalized PDUI values for each genotype. Each dot in the box plot represents the normalized PDUI value for one particular sample in the ROS/MAP cohort (n = 579 biologically independent samples). The center horizontal lines within the plot represent the median values and the boxes are bounded by the 25th and 75th percentile. The whiskers extend to the maximum and minimum values within 1.5 times of the interquartile range. Right panel: RNA-seq coverage tracks for the FAM149A 3′UTR. The bottom track shows the RefSeq gene structure. d Similar to (c) but for MAPT in the PsychENCODE cohort (n = 1520 biologically independent samples). The center horizontal lines within the plot represent the median values and the boxes are bounded by the 25th and 75th percentile. The whiskers extend to the maximum and minimum values within 1.5 times of the interquartile range. e Example of Parkinson’s disease quantile–quantile plot (QQ plot) showing the nominal P-values of brain disorder GWAS SNPs, which were binarily annotated by 3′aQTLs (yellow), sQTLs (blue), and eQTLs (light orange) with nominal P-value < 10−5. Each dot represents a GWAS SNP. All Parkinson’s disease GWAS nominal P-values are also shown as controls (black). f Enrichment of 3′aQTLs in seven brain disorder GWAS SNPs (nominal P-value < 10−5) across GTEx brain tissues. 3′aQTLs are calculated based on 2181 RNA-seq samples of brain tissues from the GTEx cohort. Data are presented as mean values ± SEM. OR odds ratio.
Fig. 3
Fig. 3. 3′aTWAS hub across 13 brain tissues and 36 non-brain tissues from ROS/MAP, PsychENCODE, and GTEx cohorts.
a Number of 3′aTWAS models across each tissue from ROS/MAP, PsychENCODE, and GTEx cohorts. DLPFC, dorsolateral prefrontal cortex. b Venn diagram showing the overlap between the number of 3′aTWAS models in ROS/MAP DLPFC, PsychENCODE DLPFC, and GTEx Brain frontal cortex (FC) tissues. c The number of 3′aTWAS models is highly correlated with the sample size in each tissue. Each dot indicates a tissue type. Yellow and gray dots indicate brain and non-brain tissue types, respectively. d A majority of human diseases of 3′aTWAS genes are not expression TWAS or splicing TWAS genes. 3′aTWAS specific genes are shown in blue. Overlap between 3′aTWAS and expression TWAS genes is shown in green. Overlap between 3′aTWAS and splicing TWAS genes is shown in red.
Fig. 4
Fig. 4. 3′aTWAS for 11 brain disorders.
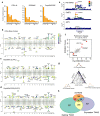
a Bar plots show the number of 3′aTWAS significant genes (FDR < 0.05) for 11 brain disorders in 13 GTEx-derived brain tissues, ROS/MAP DLPFC, and PsychENCODE DLPFC. bd Manhattan plots of 3′aTWAS results in 11 brain disorders using prediction models from GTEx Brain Cortex (b), ROS/MAP DLPFC (c), and PsychENCODE DLPFC (d). Each point represents the Z-score of a single 3′aTWAS association. Colored points represent significant associations with brain disorders at FDR < 0.05, with each of the 11 colors representing 1 of 11 different brain disorders. e Aligned Manhattan plots of Parkinson’s disease GWAS, 3′aQTLs, and eQTLs at the SNCA locus. SNPs are colored by LD (r2). f Parkinson’s disease was used as an example to assess whether similar results were observed from different 3′aTWAS prediction models built from an independent reference panel. Parkinson’s disease 3′aTWAS Z-scores in ROS/MAP and PsychENCODE are highly correlated (two-tailed Pearson correlation P-value = 2.2e−16, r = 0.70). Red triangles represent replicate genes in Parkinson’s disease which are 3′aTWAS significant and have consistent directions when using ROS/MAP and PsychENCODE as reference panels. g A ternary plot represents the colocalization probabilities for 3′aTWAS significant associations. h Venn diagram shows the overlap of 3′aTWAS significant genes (FDR < 0.05) for 11 brain disorders with expression and splicing TWAS.
Fig. 5
Fig. 5. 3′aTWAS identifies new APA-linked susceptibility genes in brain disorders.
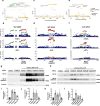
a Regional association plot. SCZ GWAS signal at the ZNF592 locus (gray) and GWAS signal after removing the effects of ZNF592 3′UTR usage (yellow). This analysis shows that the association is largely explained by ZNF592 3′UTR usage. b Aligned Manhattan plots of SCZ GWAS, 3′aQTLs, and eQTLs at the ZNF592 locus. SNPs are colored by LD (r2). c Similar to (a) for the GABRA2 locus in BIP. d Similar to (b) for the GABRA2 locus in BIP. e Similar to (a) for the ATXN3 locus in ALS. f Similar to (b) for the ATXN3 locus in ALS. g-h Western analysis of HEK293T cells (g) and SH-SY5Y cells (h) transfected with mCherry-tagged TDP-43 CTF (aa 208–414) and shRNAs for 48 h. Note: Multiple bands reflect distinct cleavage products. TDP-43 was detected using an antibody that recognizes a C-terminal epitope. i Quantification of total TDP-43 in HEK293T cells transfected with ATXN3 shRNA #1 (p = 0.0013), #2 (p = 0.0016), or #3 (p = 0.0182) relative to shRNA control. j Quantification of pTDP-43 in HEK293T cells transfected with ATXN3 shRNA #1 (p = 0.0483), #2 (p = 0.0460), or #3 (p = 0.0351) relative to shRNA control. k Quantification of total TDP-43 in SH-SY5Y cells transfected with ATXN3 shRNA #1 (p = 0.0073), #2 (0.0496), #3 (0.1098), or FLAG-ATXN3 (p = 0.5485) relative to shRNA control. l Quantification of pTDP-43 in SH-SY5Y cells transfected with ATXN3 shRNA #1 (p = 0.0121), #2 (p = 0.0961), #3 (p = 0.01050), or FLAG-ATXN3 (p = 0.0488) relative to shRNA control. Each experiment was repeated n = 3 times. Data are presented as mean values ± SEM. Statistical significance was determined by an unpaired two-tailed t-test between each condition and the shRNA control. * represents p < 0.05. ** represents p < 0.01.
Fig. 6
Fig. 6. 3′aTWAS prioritizes known and previously unknown susceptibility brain disorder genes that are connected in PPI networks and enriched in autophagy and membrane trafficking pathways.
3′aTWAS genes are connected in PPI networks with known brain disorder genes. Pathway enrichment analysis showed that 3′aTWAS genes are enriched in brain disorder related pathways, including autophagy and membrane trafficking pathways. Each node represents one 3′aTWAS gene. Node size represents the node degree.

Similar articles

Cited by

References

    1. Hoque M, et al. Analysis of alternative cleavage and polyadenylation by 3’ region extraction and deep sequencing. Nat. Methods. 2013;10:133–139. - PMC - PubMed
    1. Wang R, Nambiar R, Zheng D, Tian B. PolyA_DB 3 catalogs cleavage and polyadenylation sites identified by deep sequencing in multiple genomes. Nucleic Acids Res. 2018;46:D315–D319. - PMC - PubMed
    1. Tian B, Manley JL. Alternative polyadenylation of mRNA precursors. Nat. Rev. Mol. Cell Biol. 2017;18:18–30. - PMC - PubMed
    1. Miura P, Sanfilippo P, Shenker S, Lai EC. Alternative polyadenylation in the nervous system: to what lengths will 3’ UTR extensions take us? Bioessays. 2014;36:766–777. - PMC - PubMed
    1. Hilgers V, et al. Neural-specific elongation of 3’ UTRs during Drosophila development. Proc. Natl Acad. Sci. USA. 2011;108:15864–15869. - PMC - PubMed

Publication types

MeSH terms

Substances