. 2023 Jan 17:14:1048195.
doi: 10.3389/fimmu.2023.1048195. eCollection 2023.

Transcriptomic analysis of asthma and allergic rhinitis reveals CST1 as a biomarker of unified airways

Affiliations

Transcriptomic analysis of asthma and allergic rhinitis reveals CST1 as a biomarker of unified airways

Mingming Wang et al. Front Immunol. .

Abstract

Background: Allergic rhinitis (AR) is an important risk factor for the development of asthma. The "unified airway" theory considers the upper and lower airways as a morphological and functional whole. However, studies exploring biomarkers linking the upper and lower airways in allergic disease are lacking, which may provide insight into the mechanisms underlying AR comorbid asthma.

Purpose: To integrate bioinformatics techniques to explore biomarkers in airway allergic diseases, and to provide a molecular etiology profile for preventing the development of asthma in AR patients.

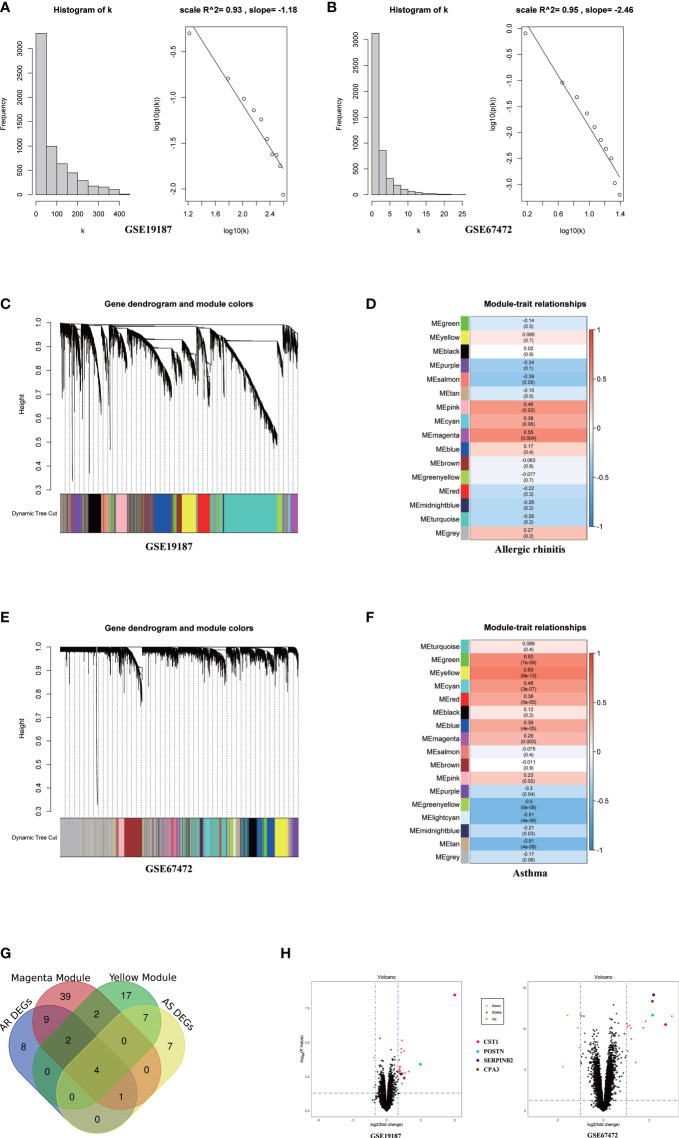
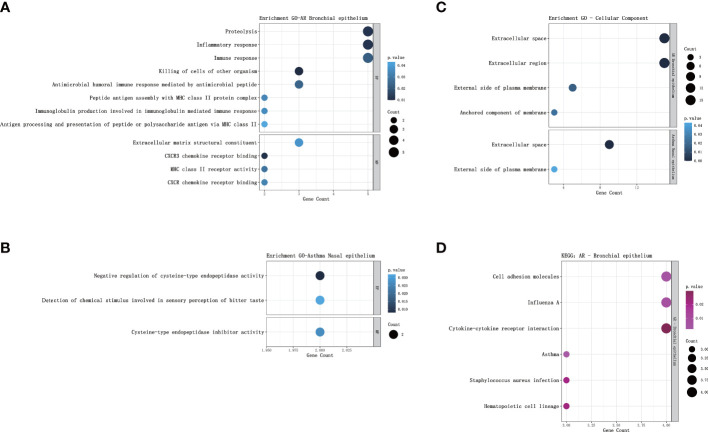
Methods: Biomarkers were screened by identifying key genes common between AR and asthma through WGCNA and differential gene analysis. GO and KEGG analyses were performed using DAVID. Immuno-infiltration analysis was performed by CIBERSORTx. The predictive value of CST1 to distinguish Th2-high asthma was determined by ROC curves. GSEA was used to analyze the signaling pathways involved in CST1. TargetScan and miRNet were combined with GSE142237 to construct ceRNA network. CMap was used to explore potential therapeutic drugs.

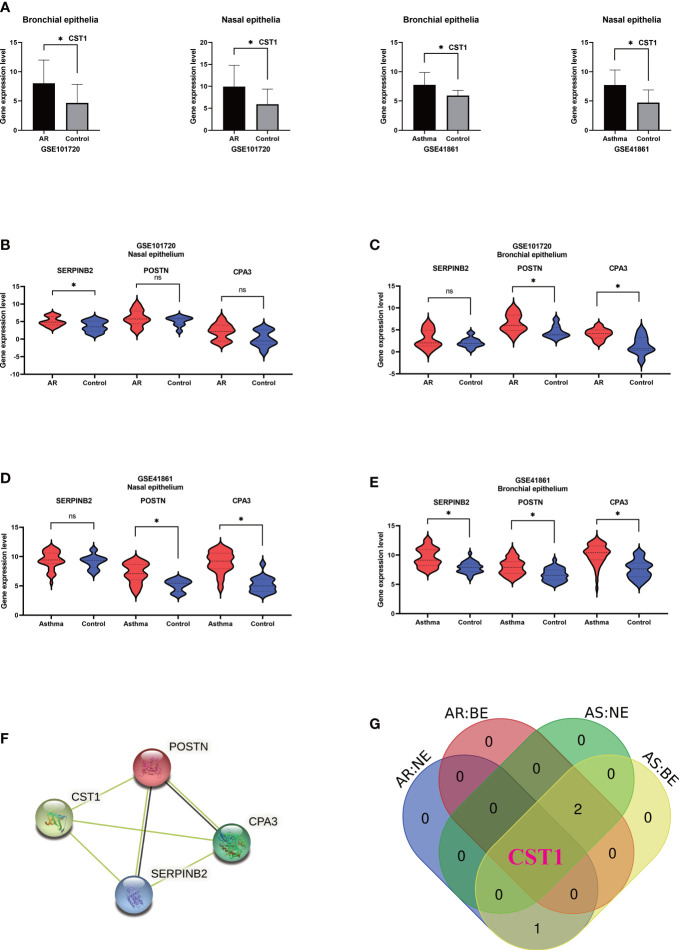
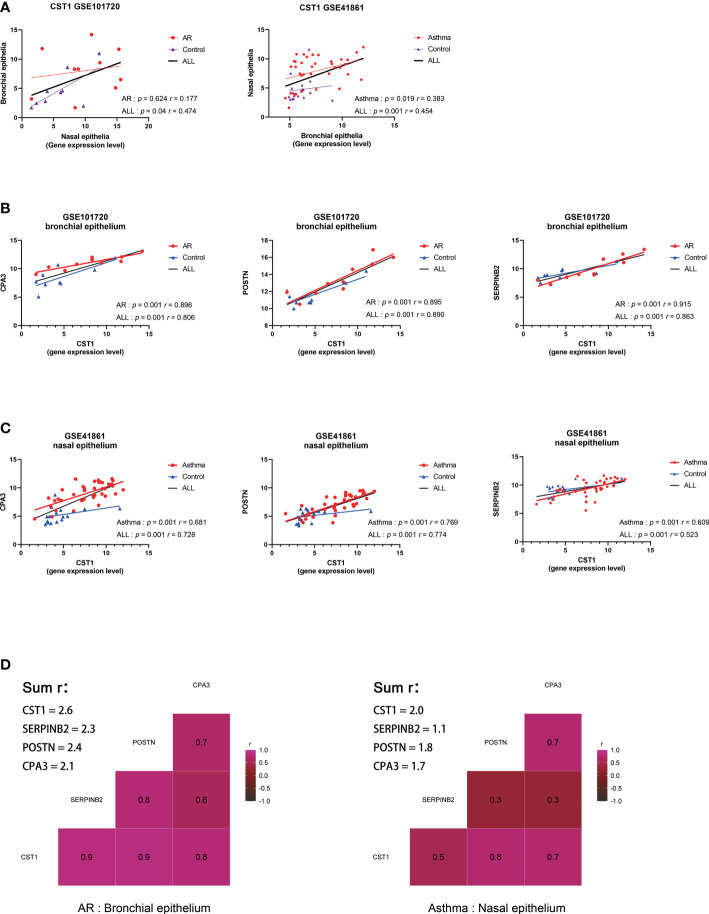
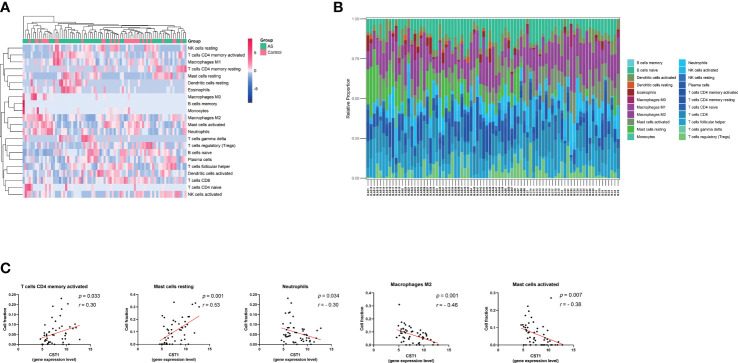
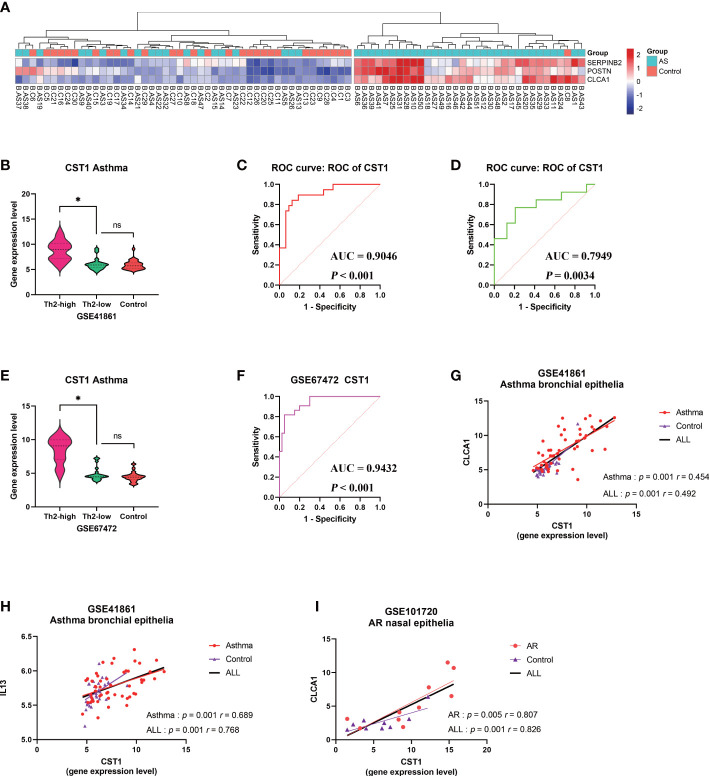
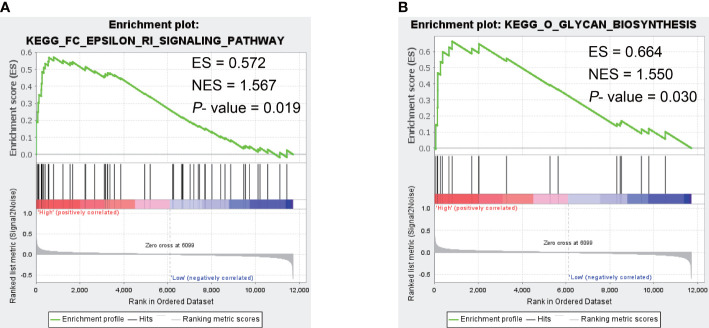
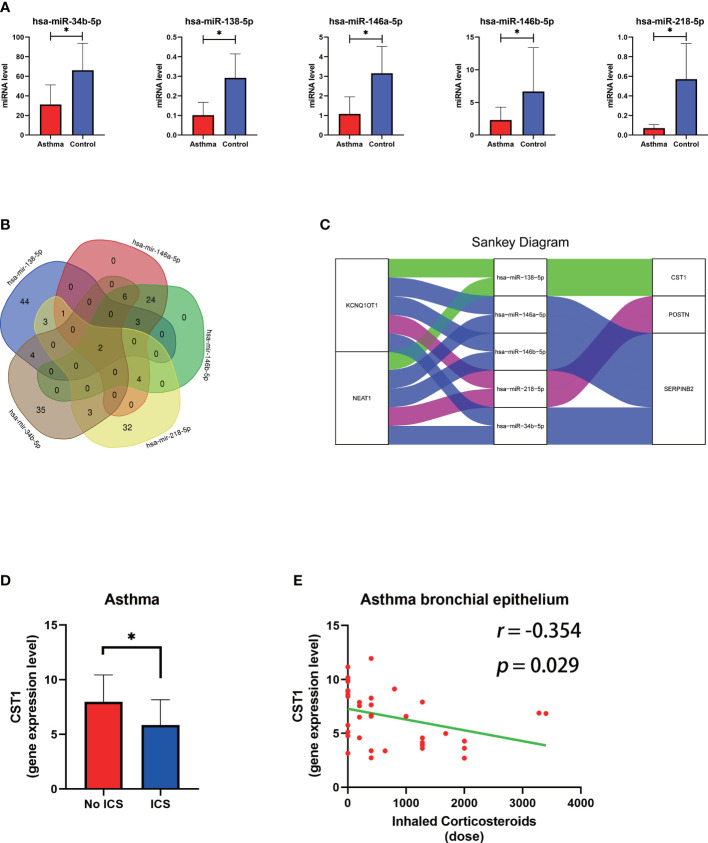
Results: Validation of datasets showed that CST1 was the only gene that was up-regulated in both upper and lower airways in patients with AR and asthma, and correlation heatmaps showed that CST1 was the gene with the highest sum of correlation coefficients. GO and KEGG analysis demonstrated that the lower airways of AR patients were mainly involved in inflammatory and immune responses, similar to asthma. Immune infiltration showed that CST1 was mainly positively correlated with activated CD4 memory T cells. According to the ROC curve, CST1 showed excellent diagnostic efficiency for Th2-high asthma. GSEA indicated that CST1 was involved in the FcϵRI signaling pathway and O-glycan biosynthesis. A ceRNA network including the lncRNAs KCNQ1OT1 and NEAT1 was constructed. Four drugs, including verrucarin-A, had the potential to prevent the development of asthma in AR patients. In addition, corticosteroids were found to downregulate CST1 expression.

Conclusion: CST1 plays a key role in the development of AR comorbid asthma and may be a biomarker for airway allergic diseases. Targeted treatment of CST1 has the potential to prevent the development of asthma in AR patients and deserves further study.

Keywords: CST1; allergic rhinitis; asthma; transcriptomic analysis; unified airways.


Conflict of interest statement

The authors declare that the research was conducted in the absence of any commercial or financial relationships that could be construed as a potential conflict of interest.

Figures

Figure 1
Figure 1
WGCNA analysis of GSE19187 and GSE67472. (A) Validation of scale-free networks for GSE19187. The histogram shows the relationship between connectivity (k) and frequency. The scatterplot x-axis represents the log of the overall network connectivity(k), and the y-axis represents the log of the corresponding frequency distribution p(k). There is a negative correlation between k and p(k), and the constructed network conforms to the scale-free network distribution. (B) Validation of scale-free networks for GSE67472. (C) Clustering dendrograms of genes for GSE19187. Different colors below indicate different co-expression modules. (D) The module-trait relationships for GSE19187. Each cell contains the corresponding correlation and p-value; red for positive correlation and blue for negative correlation. (E) Clustering dendrograms of genes for GSE67472. Different colors below indicate different co-expression modules. (F) The module-trait relationships for GSE67472. (G) The Venn diagram shows that a total of 4 key genes were screened from the DEGs and network key modules. (H) The volcano plot shows that four key genes are significantly up-regulated in both GSE19187 and GSE67472. DEGs, differentially expressed genes; AR, Allergic Rhinitis; AS, Asthma.
Figure 2
Figure 2
GO and KEGG pathway enrichment analysis of DEGs. (A) Bubble chart illustrating the terminology of significant enrichment of bronchial epithelial DEGs in AR patients in terms of BP and MF. The horizontal axis represents the gene count, and the vertical axis represents the GO terminology. The size of the dots represents the number of enriched genes, and the shades of color represent P-values. (B) Bubble chart showing the terminology of significant enrichment of nasal epithelial DEGs in asthma patients in terms of BP and MF. (C) Bubble chart showing the terminology of significant enrichment of DEGs in the nasal epithelium of asthma patients and bronchial epithelium of AR patients in terms of CC. (D) Bubble chart showing enriched signaling pathways associated with bronchial epithelial DEGs in AR patients. GO, gene ontology; KEGG, Kyoto Encyclopedia of Genes and Genomes; DEGs, differentially expressed genes; BP, Biological Processes; MF, Molecular Function; AR, Allergic Rhinitis.
Figure 3
Figure 3
Validation of key genes and identification of upper and lower airway biomarkers. (A) Expression levels of CST1 in nasal and bronchial epithelium of allergic rhinitis and asthma patients in GSE101720 and GSE41861. (B) Expression levels of three key genes in the nasal epithelium of patients with allergic rhinitis in GSE101720. (C) Expression levels of three key genes in the bronchial epithelium of allergic rhinitis patients in GSE101720. (D) Expression levels of three key genes in the nasal epithelium of asthma patients in GSE41861. (E) Expression levels of three key genes in the bronchial epithelium of asthma patients in GSE41861. (F) Interactions between proteins encoded by four key genes. (G) Venn Diagram shows that CST1 is the only key gene whose expression level is up-regulated in nasal epithelium and bronchial epithelium of both AR and asthma patients. AR, Allergic Rhinitis; AS, Asthma; NE, Nasal Epithelium; BE, Bronchial Epithelium; ns, no significance; *P < 0.05.
Figure 4
Figure 4
Correlation analysis of key genes. (A) Correlation analysis and scatterplot of CST1 expression levels in nasal and bronchial epithelium in GSE101720 and GSE41861. (B) Correlation analysis and scatter plot of the expression levels of CST1 and key genes CPA3, POSTN, and SERPINB2 in the bronchial epithelium of AR patients. (C) Correlation analysis and scatter plot of the expression levels of CST1 and key genes CPA3, POSTN, and SERPINB2 in the nasal epithelium of asthma patients. (D) Heatmap of the correlation between CST1 and key genes CPA3, POSTN, and SERPINB2 in the bronchial epithelium of AR patients and nasal epithelium of asthma patients. AR, Allergic Rhinitis.
Figure 5
Figure 5
Expression levels of CST1 in different comorbidities. (A) Histograms show the expression levels of CST1 in nasal epithelium in AR comorbid asthma, AR alone, and controls in GSE101720. (B) Histograms show the expression levels of CST1 in bronchial epithelium in AR comorbid asthma, AR alone and controls in GSE101720. (C) The histogram shows the expression levels of CST1 in nasal epithelium in AR comorbid UA, AR comorbid CA, AR alone and control group in GSE19187. AR, Allergic Rhinitis; UA, Uncontrolled Asthma; CA, Controlled Asthma; * P<0.05. ns, no significance.
Figure 6
Figure 6
Immune infiltration analysis. (A) Clustering heatmap of 22 immune cells. The bar legend in the upper right corner represents the relative fold change in cell abundance, with red for increases and green for decreases. Bar legends above represents sample clusters, with AS in green and controls in pink. (B) Histograms show the relative proportion of each immune cell in each sample. Each column represents a sample, and each color represents a cell type. (C) Correlation analysis and scatter plot of CST1 expression level and 5 immune cell fractions in the bronchial epithelium of asthma patients. AS, Asthma.
Figure 7
Figure 7
Correlation analysis between CST1 and Th2-high asthma. (A) Heatmap showing unsupervised hierarchical clustering of POSTN, CLCA1, and SERPINB2 expression levels in bronchial epithelium. Red represents a high expression level, and blue represents a low expression level. (B) Violin plots show the expression levels of CST1 in Th2-high asthma, Th2-low asthma, and controls in GSE41861. (C) ROC curves of CST1 expression levels in bronchial epithelium discriminating Th2-high asthma and Th2-low asthma in GSE41861. (D) ROC curves of CST1 expression levels in nasal epithelium discriminating Th2-high asthma and Th2-low asthma in GSE41861. (E) Violin plots show the expression levels of CST1 in Th2-high asthma, Th2-low asthma and controls in GSE67472. (F) ROC curves of CST1 expression levels in bronchial epithelium discriminating Th2-high asthma and Th2-low asthma in GSE67472. (G) Correlation analysis and scatter plot of CST1with CLCA1 expression levels in bronchial epithelium in GSE41861. (H) Correlation analysis and scatter plot of CST1 with IL13 expression levels in bronchial epithelium in GSE41861. (I) Correlation analysis and scatter plot of CST1 with CLCA1 expression levels in nasal epithelium in GSE101720. AS, Asthma; ns, no significance; *p < 0.05.
Figure 8
Figure 8
The GSEA result of CST1. (A) Fc epsilon RI signaling pathway. (B) O-glycan biosynthesis. ES, Enrichment Score; NES, Normalized Enrichment Score.
Figure 9
Figure 9
The construction of the lncRNA–miRNA–mRNA ceRNA network of key genes and relationship between ICS and CST1 expression levels. (A) Histogram of the expression levels of five predicted miRNAs in the bronchial epithelium of asthma patients. (B) Venn diagram of lncRNA predicted by the miRNet database involved in the regulation of all miRNAs. (C) The sankey diagram of the ceRNA network. (D) Histogram of CST1 expression levels in the bronchial epithelium of asthma patients with and without ICS. (E) Correlation analysis and scatter plot of CST1 expression level in bronchial epithelium of asthma patients and ICS dose. ICS, Inhaled Corticosteroids. P < 0.05.

Similar articles

Cited by

References

    1. Feng X, Lawrence MG, Payne SC, Mattos J, Etter E, Negri JA, et al. . Lower viral loads in subjects with rhinovirus-challenged allergy despite reduced innate immunity. Ann Allergy Asthma Immunol (2022) 128:414–422.e2. doi: 10.1016/j.anai.2022.01.007 - DOI - PMC - PubMed
    1. Bousquet J, van Cauwenberge P, Khaltaev N, Aria Workshop Group. World Health Organization . Allergic rhinitis and its impact on asthma. J Allergy Clin Immunol (2001) 108:S147–334. doi: 10.1067/mai.2001.118891 - DOI - PubMed
    1. Leynaert B, Neukirch C, Kony S, Guénégou A, Bousquet J, Aubier M, et al. . Association between asthma and rhinitis according to atopic sensitization in a population-based study. J Allergy Clin Immunol (2004) 113:86–93. doi: 10.1016/j.jaci.2003.10.010 - DOI - PubMed
    1. Linneberg A, Henrik Nielsen N, Frølund L, Madsen F, Dirksen A, Jørgensen T, et al. . The link between allergic rhinitis and allergic asthma: a prospective population-based study. the Copenhagen allergy study. . Allergy (2002) 57:1048–52. doi: 10.1034/j.1398-9995.2002.23664.x - DOI - PubMed
    1. Plaschke PP, Janson C, Norrman E, Björnsson E, Ellbjär S, Järvholm B. Onset and remission of allergic rhinitis and asthma and the relationship with atopic sensitization and smoking. Am J Respir Crit Care Med (2000) 162:920–4. doi: 10.1164/ajrccm.162.3.9912030 - DOI - PubMed

Publication types

Grants and funding

This research is supported by the National Natural Science Foundation of China (82171106, 81700890), Taishan Scholar Program of Shandong Province (tsqn202103166), China Postdoctoral Science Foundation (2021M691938), and Shandong Natural Science Foundation (ZR2021MH117).