. 2023 Mar 1;43(9):1475-1491.
doi: 10.1523/JNEUROSCI.1857-22.2023. Epub 2023 Feb 2.

Synaptotagmin 9 Modulates Spontaneous Neurotransmitter Release in Striatal Neurons by Regulating Substance P Secretion

Affiliations

Synaptotagmin 9 Modulates Spontaneous Neurotransmitter Release in Striatal Neurons by Regulating Substance P Secretion

Michael J Seibert et al. J Neurosci. .

Abstract

Synaptotagmin 9 (SYT9) is a tandem C2 domain Ca2+ sensor for exocytosis in neuroendocrine cells; its function in neurons remains unclear. Here, we show that, in mixed-sex cultures, SYT9 does not trigger rapid synaptic vesicle exocytosis in mouse cortical, hippocampal, or striatal neurons, unless it is massively overexpressed. In striatal neurons, loss of SYT9 reduced the frequency of spontaneous neurotransmitter release events (minis). We delved into the underlying mechanism and discovered that SYT9 was localized to dense-core vesicles that contain substance P (SP). Loss of SYT9 impaired SP release, causing the observed decrease in mini frequency. This model is further supported by loss of function mutants. Namely, Ca2+ binding to the C2A domain of SYT9 triggered membrane fusion in vitro, and mutations that disrupted this activity abolished the ability of SYT9 to regulate both SP release and mini frequency. We conclude that SYT9 indirectly regulates synaptic transmission in striatal neurons by controlling SP release.SIGNIFICANCE STATEMENT Synaptotagmin 9 (SYT9) has been described as a Ca2+ sensor for dense-core vesicle (DCV) exocytosis in neuroendocrine cells, but its role in neurons remains unclear, despite widespread expression in the brain. This article examines the role of SYT9 in synaptic transmission across cultured cortical, hippocampal, and striatal neuronal preparations. We found that SYT9 regulates spontaneous neurotransmitter release in striatal neurons by serving as a Ca2+ sensor for the release of the neuromodulator substance P from DCVs. This demonstrates a novel role for SYT9 in neurons and uncovers a new field of study into neuromodulation by SYT9, a protein that is widely expressed in the brain.

Keywords: exocytosis; neuromodulation; neuropeptide; spontaneous neurotransmitter release; synaptic transmission; synaptotagmin.


Conflict of interest statement

The authors declare no competing financial interests.

Figures

Figure 1.
Figure 1.
SYT9 is expressed in cultured cortical, hippocampal, and striatal neurons but does not support evoked neurotransmitter release. A, Immunoblot of DIV 14 cortical (CTX), hippocampal (HIP), and striatal (STR) neuronal lysates from Syt1 cKO neurons ± CRE virus; recombinant SYT1 C2AB served as a standard to quantify SYT1 expression levels. TCE staining served as a loading control. B, Quantification of the SYT1 expression levels in each of the three neuronal lysates, as a fraction of total protein (n = 6 neuronal preparations). Results are mean ± SEM: CTX = 0.100 ± 0.0152%, HIP = 0.121 ± 0.0190%, STR = 0.628 ± 0.00687%. C, Averaged eIPSC traces from Syt1 cKO striatal neurons ± CRE. D, Peak eIPSC amplitudes from – CRE (n = 21 neurons; 0.854 ± 0.145 nA) or + CRE (n = 22 neurons; 0.126 ± 0.0156 nA) neurons, showing loss of synchronous release on loss of SYT1 (p < 0.0001; Mann–Whitney U = 9). E, Same as in A, but blotting for SYT9 in lysates from WT and Syt9 KO striatal neurons, using the indicated amounts of a full-length recombinant SYT9 standard. F, Same as in B, but for SYT9 expression in WT and Syt9 KO striatal neurons (n = 4). Results are mean ± SEM: CTX = 0.00373 ± 0.0000714%, HIP = 0.00442 ± 0.000198%, STR = 0.00310 ± 0.000452%; SYT9 is expressed at ∼25-fold lower levels than SYT1. G, H, Same as in C, D, but in WT (n = 28 neurons; 1.03 ± 0.128 nA) and Syt9 KO (n = 27 neurons; 0.959 ± 0.121 nA) striatal neurons. In sharp contrast to Syt1 cKO + CRE neurons, loss of SYT9 did not affect single eIPSCs in striatal neurons (p = 0.6979; unpaired Student’s t test t = 0.3903, df = 53). ****p < 0.0001. ns, p > 0.05. For all figures, error bars indicate SEM.
Figure 2.
Figure 2.
SYT1, but not SYT9, supports evoked neurotransmitter release in cortical and hippocampal neurons. A, Averaged eIPSC traces recorded from Syt1 cKO cortical neurons with quantification of peak eIPSC amplitude – CRE (n = 20; 1.09 ± 0.141 nA) and + CRE (n = 23; 0.158 ± 0.0237 nA). B, Same as in A, but with hippocampal neurons (– CRE n = 22; 1.16 ± 0.221 nA; + CRE n = 26; 0.131 ± 0.0170 nA). C, D, Same as in A, B, but using Syt9 KO neurons; cortical neurons (WT n = 26; 1.81 ± 0.193 nA; KO n = 17; 1.50 ± 0.225 nA); hippocampal neurons (WT n = 23; 1.54 ± 0.192 nA; KO n = 22; 1.74 ± 0.226 nA). eIPSCs were disrupted in Syt1 cKO + CRE cortical (p < 0.0001; unpaired t test t = 6.96, df = 41) and hippocampal neurons (p < 0.0001; unpaired t test t = 5.07, df = 46). In contrast, eIPSCs were unaffected in Syt9 KO cortical (p = 0.3231; unpaired t test t = 1.000, df = 41) and hippocampal neurons (p = 0.4966; unpaired t test t = 0.686, df = 43).
Figure 3.
Figure 3.
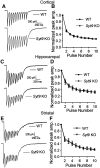
Synaptic depression was unchanged in Syt9 KO cortical, hippocampal, and striatal neurons. A, Averaged 10 Hz eIPSC traces from WT (n = 21) and Syt9 KO (n = 21) cortical neurons. B, Quantification of peak amplitudes from each pulse normalized to the first pulse, showing no difference in short-term plasticity (multiple unpaired t tests p > 0.4). C, D, Same as in A, B, but with hippocampal neurons (WT n = 17; KO n = 17; multiple unpaired t tests p > 0.5). E, F, Same as in A, B, but with striatal neurons (WT n = 35; KO n = 38; multiple unpaired t tests p > 0.2).
Figure 4.
Figure 4.
SYT9 rescues Syt1 KO phenotypes only when overexpressed. A, Immunoblots of DIV14 cortical neuronal lysates from Syt1 cKO mice, ± CRE lentivirus. TCE staining served as a loading control (in all trials, the α-SYT9 blot was stripped and reprobed with an α-SYT1 antibody, so TCE control is shown only once). + CRE neurons were later transduced with lentivirus encoding pHluorin-tagged SYT9 (pH-SYT9), resulting in either a 1× or 25× degree of overexpression compared with endogenous SYT9. Closed arrowhead indicates endogenous SYT9. Open arrowhead indicates pH-SYT9. ∼ indicates proteolytic fragments from pH-SYT9. B, Averaged eIPSC traces recorded from Syt1 cKO cortical neurons – CRE (n = 21 neurons), + CRE (n = 19), + CRE + 1× pH-SYT9 (n = 25), or + CRE + 25× pH-SYT9 (n = 23). C, Plot of normalized cumulative charge transfer of – CRE, + CRE, + CRE + 1× pH-SYT9, and + CRE + 25× pH-SYT9 conditions. D, Average eIPSC amplitudes from B. Results are mean ± SEM: – CRE = 1.773 ± 0.246 nA, + CRE = 0.122 ± 0.0114 nA, + CRE + 1× pH SYT9 = 0.257 ± 0.0375 nA, + CRE + 25× pH-SYT9 = 1.035 ± 0.119 nA (Kruskal–Wallis test H = 64.41, p < 0.0001). Subsequent pairwise analyses with Dunn’s multiple comparisons test resulted in significant p values for – CRE versus + CRE (p < 0.0001), – CRE versus + CRE + 1× pH-SYT9 (p < 0.0001), and + CRE versus + CRE + 25× pH-SYT9 (p < 0.0001); all other comparisons yielded p > 0.5. E, Time to peak for each above condition. Results are mean ± SEM: – CRE = 6.90 ± 0.329 ms, + CRE = 37.9 ± 4.44 ms, + CRE + 1× pH SYT9 = 22.1 ± 2.61 ms, + CRE + 25× pH-SYT9 = 12.5 ± 1.19 ms (Kruskal–Wallis test H = 41.41, p < 0.0001). Subsequent pairwise analyses with Dunn’s multiple comparisons test resulted in significant p values for – CRE versus + CRE (p < 0.0001), – CRE versus + CRE + 1× pH-SYT9 (p < 0.0001), and + CRE versus + CRE + 25× pH-SYT9 (p = 0.0003); all other comparisons yielded p > 0.1. SYT9 partially rescued eIPSC amplitude and time to peak, but only when overexpressed 25-fold. F, Plot of mean decay time (90%-10%) for each condition. Results are mean ± SEM: – CRE = 218 ± 14.2 ms, + CRE = 361 ± 40.6 ms, + CRE + 1× pH SYT9 = 325 ± 36.5 ms, + CRE + 25× pH-SYT9 = 256 ± 32.9 ms (Kruskal–Wallis test H = 14.93, p = 0.0019). Subsequent pairwise analyses with Dunn’s multiple comparisons test resulted in significant p values for – CRE versus + CRE (p = 0.0024) and + CRE versus + CRE + 25× pH-SYT9 (p = 0.0134); all other comparisons yielded p > 0.1. Further decay analysis was not performed because of receptor-dominated decay kinetics of IPSCs in cultured neurons. G, Representative mIPSC traces recorded from the above conditions. H, Average mIPSC frequency of each condition showing increased rates of mIPSCs in Syt1 cKO + CRE (n = 10; 2.89 ± 0.392 Hz) neurons compared with – CRE (n = 12; 0.976 ± 0.115 Hz). 1× overexpression of SYT9 was without effect (n = 16; 3.30 ± 0.250 Hz); rescue of the unclamped phenotype was observed at 25× overexpression (n = 15; 1.63 ± 0.178 Hz) (one-way ANOVA F = 20.65, R2 = 0.5584, p < 0.0001). Subsequent pairwise analyses with Sidak’s multiple comparisons test resulted in significant p values for – CRE versus + CRE (p < 0.0001), – CRE versus + CRE + 1× pH-SYT9 (p < 0.0001), and + CRE versus + CRE + 25× pH-SYT9 (p = 0.0042); all other comparisons yielded p > 0.1. I, mIPSC amplitudes were unchanged across condition (one-way ANOVA F = 0.0573, R2 = 0.00357, p = 0.982). **p < 0.01; ****p < 0.0001; compared with Syt1 cKO neurons – CRE. #p < 0.05; ##p < 0.01; ###p < 0.001; ####p < 0.0001; compared with Syt1 cKO neurons + CRE.
Figure 5.
Figure 5.
Overexpression of SYT9 leads to increased SV localization. A, Representative immunofluorescence images of cultured Syt1 cKO cortical neurons ± CRE, with and without overexpressed pH-SYT9. Rescue constructs were tagged at the N-terminus with a pHluorin to enable differential labeling of the surface and internal fractions using α-GFP antibodies (for details, see Materials and Methods). pH-SYT9 was present in both the plasma membrane (red) and on internal compartments (green). SVs were marked using an α-SYP antibody (magenta). B, Quantification of the colocalization between SYP and the following: 1× internal pH-SYT9 (n = 25, 0.618 ± 0.0112), 25× internal pH-SYT9 (n = 21, 0.747 ± 0.00484), endogenous SYT1 (n = 18, 0.752 ± 0.00613), and endogenous SYT9 (n = 18, 0.597 ± 0.00918) (one-way ANOVA F = 86.69, R2 = 0.7693, p < 0.0001). Subsequent pairwise analyses with Tukey’s multiple comparisons test resulted in significant p values for 1× (int.) versus 25× (int.) (p < 0.0001), 1× (int.) versus Endo SYT1 (p < 0.0001), Endo SYT9 versus 25× (int.) (p < 0.0001), and Endo SYT1 versus Endo SYT9 (p < 0.0001); all other comparisons yielded p > 0.1. ****p < 0.0001. ns, p > 0.05. Scale bars, 20 μm.
Figure 6.
Figure 6.
Syt9 KO striatal neurons display decreased mIPSC frequency. A, Representative mIPSC traces recorded from WT (n = 33 neurons; 1.01 ± 0.0994 Hz) and Syt9 KO (n = 29; 0.432 ± 0.0550 Hz) striatal neurons. B, Overlay of averaged mIPSCs from the two above conditions, revealing no change in kinetics or amplitude. C, mIPSC frequency is reduced in Syt9 KO striatal neurons (p < 0.0001; Welch’s t test t = 5.082, df = 49.31). ****p < 0.0001.
Figure 7.
Figure 7.
mIPSC frequency is unaltered in cultured Syt9 KO cortical and hippocampal neurons. A, Representative mIPSC traces recorded from WT and Syt9 KO cortical neurons. B, Overlay of averaged mIPSCs, revealing no apparent change in kinetics or amplitude. C, Average mIPSC frequency of WT (n = 27; 1.53 ± 0.166 Hz) and Syt9 KO (n = 27; 1.59 ± 0.199 Hz) cortical neurons (p = 0.8181; unpaired t test; t = 0.231, df = 47). DF, Same as AC, but using hippocampal neurons (WT n = 24; 3.29 ± 0.325 Hz; KO n = 27; 3.09 ± 0.363 Hz) (p = 0.684; unpaired t test t = 0.410, df = 49).
Figure 8.
Figure 8.
Unchanged synaptic density in Syt9 KO striatal neurons. A, Representative images of cultured striatal neurons stained with α-Gephyrin (red) and α-VGAT (green) antibodies with a neurite mask generated from MAP2 staining (magenta). Gephyrin and VMAT overlap within the neurite mask were counted (purple puncta within synapse mask). Scale bars, 20 μm. B, Number of synapses per micrometer is unaltered in cultured Syt9 striatal neurons (n = 15; 0.823 ± 0.0476 synapses/μm) compared with WT neurons (n = 15; 0.837 ± 0.0434 synapses/μm) (p = 0.8212; unpaired t test t = 0.228, df = 28).
Figure 9.
Figure 9.
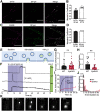
SYT9 regulates the secretion of SP-pHluorin from striatal neurons. A, Representative images of cultured striatal neurons stained with α-SYT9 (magenta) and α-GFP (SP-pH) (green) antibodies; channels are merged on the right. B, Quantification was conducted using the Mander’s overlap coefficient; SYT9 overlaps with SP-pH (0.655 ± 0.0257), and SP-pH overlaps with SYT9 to a higher degree (0.808 ± 0.0174). C, D, Same as in A, B, but costained with α-CHGB (magenta) and α-GFP antibodies (green). SP-pH overlaps with CHGB to a high degree (0.855 ± 0.0118), and CHGB overlaps with SP-pH to a similar degree (0.881 ± 0.00755), confirming that SP-pH is targeted to DCVs. E, Schematic of the SP-pH release assay. F, Representative traces of individual SP-pH vesicle fusion events; the stimulation paradigm is overlaid in blue, and alkalinization of DCVs with NH4Cl is shown in green. G, Pool size per neuron was unchanged in Syt9 KO neurons (n = 27 neurons; 731 ± 113 vesicles) compared with WT neurons (n = 21; 657 ± 120 vesicles) (p = 0.6034; Mann–Whitney U = 248). H, The released fraction of SP-pH is reduced in Syt9 KO neurons (n = 27; 0.0398 ± 0.00926) compared with WT (n = 21; 0.103 ± 0.0189) (p = 0.0049; Mann–Whitney U = 143.5). I, Plot of cumulative SP-pH fusion events; again, the stimulus protocol is indicated in blue. J, Histogram of SP-pH release event duration for WT (median ± SEM, 1.00 ± 0.290 s) and Syt9 KO (median ± SEM, 1.80 ± 0.614 s) striatal neurons. K, Representative ROIs in a time-lapse, demonstrating changes in SP-pH fluorescence over the course of an imaging experiment, taken from Movie 1; time points are indicated, with the stimulus at t = 0. The last image shows the same ROI after perfusion with NH4Cl to neutralize the luminal pH of SP-pH-bearing DCVs, as indicated in F. **p < 0.01.
Figure 10.
Figure 10.
The trafficking of SP-pH-bearing DCVs is unaltered in Syt9 KO striatal neurons. A, Top, Representative image of a 90 µm region of a striatal neuron transfected with SP-pH; image was captured after perfusion with NH4Cl. Bottom panels, Color inverted kymographs of this region, over a 30 s time period; each track in the kymograph was traced and quantified in the bottom panel (yellow lines). B, Quantification of the displacement and direction of SP-pH vesicles. No significant differences were detected between WT (n = 98 vesicles, from 5 cells) versus Syt9 KO (n = 101 vesicles, from 5 cells) striatal neurons (two-way ANOVA; F(4,40) = 1.903, p = 0.1289).
Figure 11.
Figure 11.
Treatment with SP rescues Syt9 KO mIPSC phenotype. A, Representative mIPSC traces recorded from striatal neurons with measured mini frequencies as follows: WT (n = 35 neurons; 0.931 ± 0.0709 Hz); Syt9 KO (n = 39; 0.430 ± 0.0385 Hz); WT with application of 100 nm SP (n = 28; 1.07 ± 0.0743 Hz) or 10 nm SR140333 (n = 34; 0.578 ± 0.0487 Hz); Syt9 KO with application of 100 nm SP (n = 35; 1.40 ± 0.145 Hz), 100 nm GR73632 (n = 26; 0.967 ± 0.120 Hz), 10 nm SR140333 (n = 27; 0.564 ± 0.0795 Hz), 100 nm Leu-enkephalin (n = 23; 0.374 ± 0.0482 Hz), 100 nm dynorphin A (n = 23; 0.466 ± 0.0722 Hz), or 100 nm cholecystokinin (n = 20; 0.450 ± 0.0645 Hz) in the bath solution. B, Plot of average frequency of mIPSCs recorded from A; Kruskal–Wallis test H = 111, p < 0.0001. Subsequent pairwise analyses with Dunn’s multiple comparisons test resulted in significant p values for WT versus Syt9 KO (p < 0.0001), WT versus WT + SR140333 (p = 0.0322), WT versus KO + L-Enk (p < 0.0001), WT versus KO + DynA (p = 0.0013), WT versus KO + CCK8 (p = 0.0011), WT versus KO + SR140333 (p = 0.0133), KO versus KO + SP (p < 0.0001), KO versus KO + GR73632 (p = 0.0005), and KO versus WT + SP (p < 0.0001); all other comparisons yielded p > 0.999. C, Plot of average mIPSC amplitudes for each condition; Kruskal–Wallis test H = 16.55, p = 0.562. *p < 0.05; **p < 0.01; ****p < 0.0001; compared with WT neurons. ###p < 0.001; ####p < 0.0001; compared with Syt9 KO neurons.
Figure 12.
Figure 12.
Basal presynaptic [Ca2+]i is unchanged in Syt9 KO striatal neurons. A, In each trial, the baseline signal was recorded for 3 s, followed by high-frequency train stimulation to obtain the maximal fluorescence of the indicator, to calculate the basal [Ca2+]i (see Materials and Methods). B, Basal presynaptic [Ca2+]i in 1.5 mm [Ca2+]e did not differ between WT (n = 45; mean ± SEM, 121 ± 6.99 nm) and Syt9 KO (n = 44; mean ± SEM, 130 ± 11.7 nm) striatal neurons (p = 0.8735; Mann–Whitney U = 970). ns, p > 0.05.
Figure 13.
Figure 13.
Ca2+•C2A from SYT9 regulates membrane fusion in vitro. A, Left, Reconstituted split t-SNARE fusion assay where Ca2+•SYT fragments must fold soluble SNAP-25B onto membrane-embedded SYX1A for fusion with SYB2 proteoliposomes to occur. Representative fusion traces, using each isolated C2 domain, C2A and C2B, from SYT1 and SYT9 are shown (left); the tandem C2 domains, C2AB, for each isoform were also assayed in parallel but were omitted for clarity. The isolated C2A domain, but not the C2B domain, of SYT9 stimulated fusion; in SYT1, C2B, rather than C2A, stimulated fusion (Gaffaney et al., 2008). Right, The extent of fusion (80 min), using all SYT constructs, in the presence (+) or absence (–) of Ca2+, is plotted (n ≥ 3). B, Binding of SYT9 C2A, C2B, and C2AB to PS-bearing liposomes was monitored via a cosedimentation assay. Representative SDS-PAGE gels of protein from equal fractions of the supernatant (S), and pellet (P), as well as the total input (T), in the absence (0.2 mm EGTA) or presence of Ca2+ (1 mm free), using liposomes with 0%, 15%, and 25% PS, are shown (left). Protein band intensities were normalized to the total input and plotted (right; n ≥ 3). C, Representative ITC traces showing the heat of Ca2+ binding to the isolated C2 domains of WT SYT9; the CLM domains (C2Am and C2Bm) were analyzed in parallel, confirming that they fail to bind Ca2+ (n = 4 protein preparations). Thermodynamic values are provided in Table 1.
Figure 14.
Figure 14.
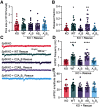
The Ca2+ binding activity of the C2A domain of SYT9 is required for its action in neurons. A, SP-containing DCV pool size was unchanged across Syt9 KO rescue conditions (p = 0.6272; Kruskal–Wallis test H = 2.598). B, The reduction in SP-pH release in Syt9 KO striatal neurons (n = 21 neurons; 0.0394 ± 0.00650) was rescued by expression of WT SYT9 (n = 23; 0.0889 ± 0.0132) or the C2ABm mutant (n = 24; 0.110 ± 0.0187). In contrast, the C2AmB (n = 22; 0.0382 ± 0.0112) and C2AmBm mutants (n = 19; 0.0356 ± 0.00712) both failed to rescue release (Kruskal–Wallis test H = 27.65; p < 0.0001). Subsequent pairwise analyses with Dunn’s multiple comparisons test resulted in significant p values for KO versus KO + WT (p = 0.0158) and KO versus KO + C2ABm (p = 0.0069); all other comparisons yielded p > 0.999. Release was monitored as shown in Figure 9E-K. C, Representative mIPSC traces recorded from striatal neurons. D, Average frequency of mIPSCs recorded from C as follows: Syt9 KO (n = 17; 0.493 ± 0.0434 Hz), Syt9 KO + WT rescue (n = 24; 1.15 ± 0.103 Hz), Syt9 KO + C2AmB rescue (n = 19; 0.487 ± 0.0623 Hz), Syt9 KO + C2ABm rescue (n = 20; 1.17 ± 0.0856 Hz), and Syt9 KO + C2AmBm rescue (n = 19; 0.531 ± 0.0473 Hz) (Kruskal–Wallis test H = 57.16, p < 0.0001). Subsequent pairwise analyses with Dunn’s multiple comparisons test resulted in significant p values for KO versus KO + WT (p < 0.0001) and KO versus KO + C2ABm (p < 0.0001); all other comparisons yielded p > 0.999. E, mIPSC amplitudes measured from C. Syt9 KO (n = 17; 26.4 ± 2.15 pA), Syt9 KO + WT rescue (n = 24; 28.4 ± 1.45 pA), Syt9 KO + C2AmB rescue (n = 19; 25.3 ± 1.99 pA), Syt9 KO + C2ABm rescue (n = 20; 24.7 ± 1.59 pA), and Syt9 KO + C2AmBm rescue (n = 19; 24.4 ± 2.02 pA). No significant differences in average amplitudes between conditions were observed (Kruskal–Wallis test H = 3.92, p = 0.417). Expression of WT SYT9 and the C2ABm mutant in Syt9 KO neurons rescued both SP release and the mini frequency phenotypes, while the C2Am and C2AmBm mutants failed to rescue these phenotypes. *p < 0.05; **p < 0.01; ****p < 0.0001; comparisons with the Syt9 KO condition.
Figure 15.
Figure 15.
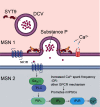
SYT9 indirectly controls mini frequency in striatal neurons by serving as a Ca2+ sensor for SP exocytosis. A model in which SYT9 serves as a Ca2+ sensor that regulates the exocytosis of SP-containing DCVs from striatal neurons. Released SP then activates the NK1 receptor, which in turn activates the IP3 pathway via Gq/11 and phospholipase C (PLC), leading to increased Ca2+ efflux from the ER, to promote spontaneous neurotransmitter release rates. SP likely acts in both a paracrine and an autocrine fashion; the signal transduction pathway in MSN 2 is also present in MSN 1 but was omitted for clarity.

Similar articles

Cited by

References

    1. Angulo JA, McEwen BS (1994) Molecular aspects of neuropeptide regulation and function in the corpus striatum and nucleus accumbens. Brain Res Rev 19:1–28. 10.1016/0165-0173(94)90002-7 - DOI - PubMed
    1. Bai H, Xue R, Bao H, Zhang L, Yethiraj A, Cui Q, Chapman ER (2016) Different states of synaptotagmin regulate evoked versus spontaneous release. Nat Commun 7:10971. 10.1038/ncomms10971 - DOI - PMC - PubMed
    1. Berg EA, Johnson RJ, Leeman SE, Boyd N, Kimerer L, Fine RE (2000) Isolation and characterization of substance P-containing dense-core vesicles from rabbit optic nerve and termini. J Neurosci Res 62:830–839. 10.1002/1097-4547(20001215)62:6<830::AID-JNR10>3.0.CO;2-E - DOI - PubMed
    1. Bhalla A, Tucker WC, Chapman ER (2005) Synaptotagmin isoforms couple distinct ranges of Ca2+, Ba2+, and Sr2+ concentration to SNARE-mediated membrane fusion. Mol Biol Cell 16:4755–4764. 10.1091/mbc.e05-04-0277 - DOI - PMC - PubMed
    1. Bhalla A, Chicka MC, Tucker WC, Chapman ER (2006) Ca2+-synaptotagmin directly regulates t-SNARE function during reconstituted membrane fusion. Nat Struct Mol Biol 13:323–330. 10.1038/nsmb1076 - DOI - PubMed

Publication types

LinkOut - more resources