

Predictive model of transcriptional elongation control identifies trans regulatory factors from chromatin signatures
- PMID: 36727445
- PMCID: PMC9976927
- DOI: 10.1093/nar/gkac1272
Predictive model of transcriptional elongation control identifies trans regulatory factors from chromatin signatures
Abstract
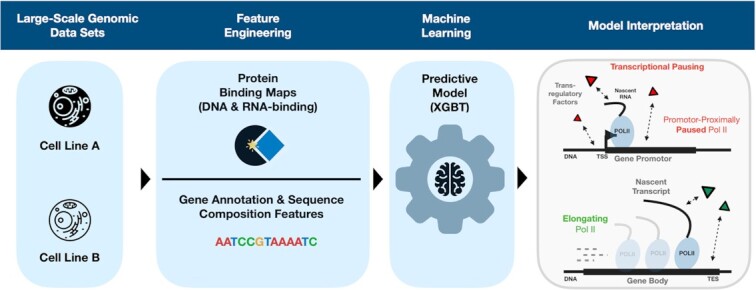
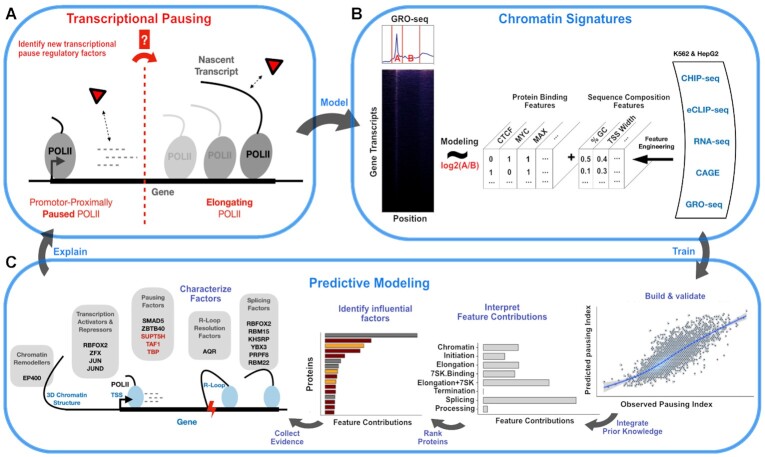
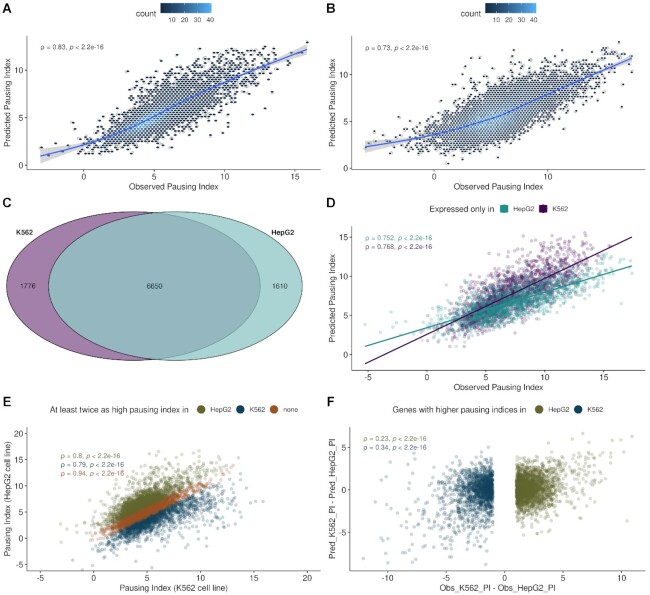
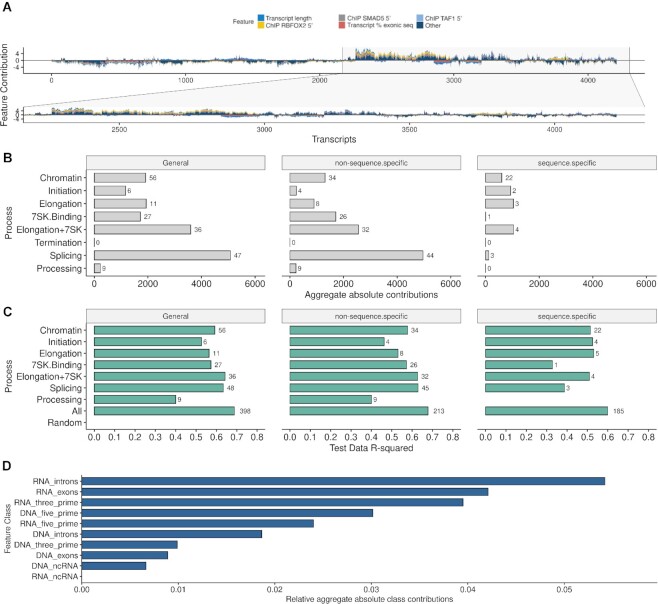
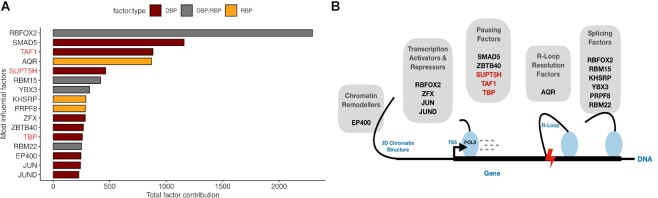
Promoter-proximal Polymerase II (Pol II) pausing is a key rate-limiting step for gene expression. DNA and RNA-binding trans-acting factors regulating the extent of pausing have been identified. However, we lack a quantitative model of how interactions of these factors determine pausing, therefore the relative importance of implicated factors is unknown. Moreover, previously unknown regulators might exist. Here we address this gap with a machine learning model that accurately predicts the extent of promoter-proximal Pol II pausing from large-scale genome and transcriptome binding maps and gene annotation and sequence composition features. We demonstrate high accuracy and generalizability of the model by validation on an independent cell line which reveals the model's cell line agnostic character. Model interpretation in light of prior knowledge about molecular functions of regulatory factors confirms the interconnection of pausing with other RNA processing steps. Harnessing underlying feature contributions, we assess the relative importance of each factor, quantify their predictive effects and systematically identify previously unknown regulators of pausing. We additionally identify 16 previously unknown 7SK ncRNA interacting RNA-binding proteins predictive of pausing. Our work provides a framework to further our understanding of the regulation of the critical early steps in transcriptional elongation.
© The Author(s) 2023. Published by Oxford University Press on behalf of Nucleic Acids Research.
Figures
Similar articles
-
Predicting RNA polymerase II transcriptional elongation pausing and associated histone code.Brief Bioinform. 2024 May 23;25(4):bbae246. doi: 10.1093/bib/bbae246. Brief Bioinform. 2024. PMID: 38783706 Free PMC article.
-
An mRNA Capping Enzyme Targets FACT to the Active Gene To Enhance the Engagement of RNA Polymerase II into Transcriptional Elongation.Mol Cell Biol. 2017 Jun 15;37(13):e00029-17. doi: 10.1128/MCB.00029-17. Print 2017 Jul 1. Mol Cell Biol. 2017. PMID: 28396559 Free PMC article.
-
RNA Polymerase II Promoter-Proximal Pausing and Release to Elongation Are Key Steps Regulating Herpes Simplex Virus 1 Transcription.J Virol. 2020 Feb 14;94(5):e02035-19. doi: 10.1128/JVI.02035-19. Print 2020 Feb 14. J Virol. 2020. PMID: 31826988 Free PMC article.
-
RNA polymerase II pausing as a context-dependent reader of the genome.Biochem Cell Biol. 2016 Feb;94(1):82-92. doi: 10.1139/bcb-2015-0045. Epub 2015 Sep 15. Biochem Cell Biol. 2016. PMID: 26555214 Free PMC article. Review.
-
Cracking the control of RNA polymerase II elongation by 7SK snRNP and P-TEFb.Nucleic Acids Res. 2016 Sep 19;44(16):7527-39. doi: 10.1093/nar/gkw585. Epub 2016 Jul 1. Nucleic Acids Res. 2016. PMID: 27369380 Free PMC article. Review.
Cited by
-
Tyrosine 1-phosphorylated RNA polymerase II transcribes PROMPTs to facilitate proximal promoter pausing and induce global transcriptional repression in response to DNA damage.Genome Res. 2024 Mar 20;34(2):201-216. doi: 10.1101/gr.278644.123. Genome Res. 2024. PMID: 38467418 Free PMC article.
References
-
- Sallie R. Transcriptional homeostasis: a mechanism of protein quality control. Med. Hypotheses. 2004; 63:232–234. - PubMed
-
- Mitsis T., Efthimiadou A., Bacopoulou F., Vlachakis D., Chrousos G.P., Eliopoulos E.. Transcription factors and evolution: an integral part of gene expression (Review). World Acad. Sci. J. 2020; 2:3–8.
Publication types
MeSH terms
Substances
LinkOut - more resources
Full Text Sources
Miscellaneous
