. 2023 Jan 16:14:1085314.
doi: 10.3389/fphar.2023.1085314. eCollection 2023.

Neuroregeneration of injured peripheral nerve by fraction B of catfish epidermal secretions through the reversal of the apoptotic pathway and DNA damage

Affiliations

Neuroregeneration of injured peripheral nerve by fraction B of catfish epidermal secretions through the reversal of the apoptotic pathway and DNA damage

Taiba A Al-Arbeed et al. Front Pharmacol. .

Abstract

Introduction: Crush injuries occur from acute traumatic nerve compression resulting in different degrees of neural damage leading to permanent functional deficits. Recently, we have shown that administration of Fraction B (FB) derived from catfish epidermal secretions accelerates healing of damaged nerve in a sciatic nerve crush injury, as it ameliorates the neurobehavioral deficits and enhances axonal regeneration, as well as protects spinal neurons and increases astrocytic activity and decreasing GAP-43 expression. The present study aimed to investigate the role of FB treatment on the apoptotic pathway in the neuroregeneration of the sciatic nerve crush injury. Methods: Male Wistar rats were randomly assigned into five groups: (I) SHAM, (II) CRUSH, (III) CRUSH + (1.5 mg/kg) FB, (IV) CRUSH + (3 mg/kg) FB, and (V) CRUSH + (4.5 mg/kg) FB. Rats underwent sciatic nerve crush surgery, followed by treatment with FB administered intraperitoneally (IP) daily for two weeks and then sacrificed at the end of the fourth week. Results: FB improved the recovery of neurobehavioral functions with a concomitant increase in axonal regeneration and neuroprotective effects on spinal cord neurons following crush injury. Further, FB enhanced Schwann cells (SCs) proliferation with a significant increase in myelin basic protein expression. FB-treated animals demonstrated higher numbers of neurons in the spinal cord, possibly through ameliorating oxidative DNA damage and alleviating the mitochondrial-dependent apoptotic pathway by inhibiting the release of cytochrome c and the activation of caspase-3 in the spinal cord neurons. Conclusion: FB alleviates the neurodegenerative changes in the lumbar spinal cord neurons and recovers the decrease in the neuronal count through its anti-apoptotic and DNA antioxidative properties.

Keywords: apoptosis; catfish fraction B; nerve injury; neuroprotection; neuroregeneration.


Conflict of interest statement

JMH and WMR hold patents on the use of products from the catfish gel for treating various diseases. TA declares that the research was conducted in the absence of any commercial or financial relationships that could be construed as a potential conflict of interest. The remaining authors declare that the research was conducted in the absence of any commercial or financial relationships that could be construed as a potential conflict of interest.

Figures

FIGURE 1
FIGURE 1
(A) Differences in the mean values for the foot position analysis for the experimental groups. ¥ indicates p < 0.001, SHAM vs. CRUSH, CRUSH+(1.5 mg/kg)FB, CRUSH+(3 mg/kg)FB and CRUSH+(4.5 mg/kg) FB; * indicates p < 0.001, CRUSH vs. SHAM, CRUSH+(3 mg/kg)FB and CRUSH+(4.5 mg/kg)FB; φ indicates p < 0.01, CRUSH+(1.5 mg/kg)FB vs. CRUSH+(3 mg/kg)FB and CRUSH+(4.5 mg/kg)FB; α indicates no significant difference between SHAM vs. CRUSH+(3 mg/kg)FB and CRUSH+(4.5 mg/kg)FB. (B) Differences in the mean values for the analysis of the spread outcome. The treated rats showed statistically significant clinical recovery following sciatic nerve injury in toe spread.¥ indicates p < 0.001, SHAM vs. CRUSH, CRUSH+(1.5 mg/kg)FB, CRUSH+(3 mg/kg)FB and CRUSH+(4.5 mg/kg)FB; * indicates p < 0.01, SHAM vs. CRUSH, and CRUSH+(1.5 mg/kg)FB; φ indicates p < 0.01, CRUSH+(3 mg/kg)FB vs. CRUSH and CRUSH+(3 mg/kg)FB; αindicates p < 0.05, CRUSH+(4.5 mg/kg)FB vs. CRUSH and CRUSH+(1.5 mg/kg)FB. (C) Evaluation of functional recovery as measured by EPT following crush injury and FB treatment. EPT was measured by calculating the percentage of the functional deficit; thus, a high value indicates a poor outcome. ¥ indicates p < 0.001, SHAM vs. CRUSH, CRUSH+(1.5 mg/kg)FB, CRUSH+(3 mg/kg)FB and CRUSH+(4.5 mg/kg)FB; * indicates p < 0.01, CRUSH vs. CRUSH+(3 mg/kg)FB; φ indicates p < 0.01, CRUSH+(4.5 mg/kg)FB vs. CRUSH; Ѱ indicates p < 0.05, CRUSH and CRUSH+(4.5 mg/kg)FB vs. CRUSH+(1.5 mg/kg)FB; αindicates p < 0.05, CRUSH+(1.5 mg/kg)FB vs. CRUSH; # indicates p < 0.01, CRUSH+(3 mg/kg)FB vs. CRUSH; ** indicates p < 0.01, CRUSH+(1.5 mg/kg)FB vs. CRUSH+(4.5 mg/kg)FB; & indicates p < 0.001, CRUSH+(4.5 mg/kg). (D) Differences in the mean values of the hopping test outcome among the experimental animal groups. ¥ indicates p < 0.001, SHAM vs. CRUSH, CRUSH+(1.5 mg/kg)FB, CRUSH+(3 mg/kg)FB and CRUSH+(4.5 mg/kg)FB; * indicates p < 0.01, SHAM vs. CRUSH, and CRUSH+(3 mg/kg)FB; φ indicates p < 0.05, CRUSH+(1.5 mg/kg)FB and CRUSH+(3 mg/kg)FB vs. SHAM; αindicates p < 0.05, CRUSH vs. SHAM, CRUSH+(3 mg/kg)FB and CRUSH+(4.5 mg/kg)FB. (E) The rotarod test was performed to evaluate motor coordination and motor learning. The treated groups showed marked improvement in this test compared to their performance on the first day of testing. In contrast, the CRUSH group did not show an improvement in the rotarod test. ¥ indicates p < 0.001, SHAM vs. CRUSH, CRUSH+(1.5 mg/kg)FB, CRUSH+(3 mg/kg)FB and CRUSH+(4.5 mg/kg)FB; φ indicates p < 0.05, CRUSH+(4.5 mg/kg)FB vs. SHAM and CRUSH; * indicates p < 0.01, SHAM vs. CRUSH and CRUSH+(1.5 mg/kg)FB; Ѱ indicates p < 0.05 CRUSH+(3 mg/kg)FB and CRUSH+(4.5 mg/kg)FB vs. SHAM; α p < 0.05, CRUSH+(3 mg/kg)FB vs. CRUSH and CRUSH+(1.5 mg/kg)FB.
FIGURE 2
FIGURE 2
(A) Time course of hot plate latency. Nerve crush injury produced a severe nociception deficit in the Crush group. ¥ indicates p < 0.01, SHAM vs. CRUSH, CRUSH+(3 mg/kg) FB and CRUSH+(4.5 mg/kg) FB; * indicates p < 0.05, CRUSH+(1.5 mg/kg) FB vs. SHAM; φ indicates p < 0.05, SHAM vs. CRUSH and CRUSH+(3 mg/kg) FB; αindicates p < 0.01, CRUSH vs. SHAM; Ѱ indicates p < 0.05, CRUSH+(4.5 mg/kg) FB vs. CRUSH. (B) Time course of tail flick withdrawal latency. The treated group showed significant nociceptive recovery compared with the CRUSH group.*indicates p < 0.01, CRUSH vs. SHAM and CRUSH+(3 mg/kg) FB; α indicates p < 0.05, CRUSH+(1.5 mg/kg) FB vs. CRUSH; φ indicates p < 0.05, CRUSH+(4.5 mg/kg) FB vs. CRUSH; ¥ indicates p < 0.01, CRUSH vs. SHAM, CRUSH+(1.5 mg/kg) FB and CRUSH+(4.5 mg/kg) FB; # indicates p < 0.001, CRUSH+(3 mg/kg) FB vs. CRUSH; Ѱ indicates p < 0.05, CRUSH vs. SHAM and CRUSH+(1.5 mg/kg) FB; ** indicates p < 0.05, CRUSH+(4.5 mg/kg) FB vs. CRUSH+(1.5 mg/kg) FB.
FIGURE 3
FIGURE 3
(A–F): Visualization of axonal regeneration using whole-mount staining of the crushed sciatic nerve. (A) Comparison of the number of individual SC nuclei among experimental groups. (A1-5) representative images of Hoechst stained nuclei located at the crush injury site magnified from (A6-10) representative images. (B) The graph shows the quantification of Hoechst-stained nuclei. The number of nuclei in the field was analyzed from three or four sections, and average data from five independent experimental groups were compared. Data are expressed as mean ± SEM (n = 8). *p < 0.05, **p < 0.01, ***p < 0.001. (C) Re-growing axons of the sciatic nerve. The sciatic nerve is stained with neurofilament antibody 4 weeks after nerve crush injury (C6-10). At this point, more regenerating axons have grown within the FB-treated groups (C3-5) compared to the crush group (C2). (D) Neurofilament intensity was quantified in the graph using 4 different sections of the crush injury site. Data are expressed as mean ± SEM (n = 8). *p < 0.05. (E) Expression of S100 in SCs after 4 weeks from crush sciatic nerve injury. Images (E 6-10) represent whole-mount sciatic nerve preparations at the crush injury site. Higher magnification of crush site in (E 1-5) shows S100 positive SCs. (F) S100 intensity was quantified in the graph using 4 different sections of the crush injury site. Data are expressed as mean ± SEM (n = 8). *p < 0.05.
FIGURE 4
FIGURE 4
Whole-mount staining showing cell proliferation following sciatic nerve crush injury. Sciatic nerve was stained with myelin basic protein (MBP) in (A 2, 6, 10, 14, and 18) and Ki67 antibodies in (A 3, 7, 11, 15 and, 19) to show the presence of myelinated SCs and cell proliferation (Ki67) at 4 weeks after nerve crush injury. Nuclei are counterstained with Hoechst dye (Ho) in (A 1, 5, 9, 13 and 17). (B) Quantification of the number of individual SC nuclei among different experimental groups. The number of nuclei from 4 different sections was analyzed, and average data from five independent experimental groups were compared. Data are expressed as mean ± SEM (n = 8). *p < 0.05, **p < 0.01, ***p < 0.001. (C) Quantification of MBP fluorescence intensity in different groups. MBP intensity was analyzed from 4 different sections, and average data from five independent experimental groups were compared. Data are expressed as mean ± SEM (n = 8). *p < 0.05, **p < 0.01, ***p < 0.001. (D) Quantification of Ki67 fluorescence intensity in different groups. The intensity of Ki67-expressed cells was analyzed from 4 different sections, and average data from five independent experimental groups were compared. Data are expressed as mean ± SEM (n = 8). *p < 0.05, **p < 0.01, ***p < 0.001.
FIGURE 5
FIGURE 5
(A–O): Representative photomicrographs (×4 and ×40 objectives) of Nissl staining of the ipsilateral ventral (VH) and dorsal horns (DH) of the lumbar spinal cord transverse section. SHAM group shows normal neurons in the ipsilateral ventral and dorsal horns (B, C). Compared to the SHAM group, the CRUSH group displays irregular neurons with eccentric nuclei (E, F). FB-treated groups (G–O) show protected neurons compared to the CRUSH group (D–F). (P) Statistical analysis of the mean number of ventral horn motor neurons among the five experimental groups. CRUSH animals showed a reduced number of neurons after sciatic nerve crush injury. FB-treated groups displayed a significant increase in ventral horn neurons compared to the CRUSH group. Data are expressed as mean ± SEM. *p < 0.05, **p < 0.01, and ***p < 0.001. (Q) Statistical analysis of the mean number of dorsal horn sensory neurons among the five experimental groups. CRUSH animals showed a reduced number of neurons after sciatic nerve crush injury. FB-treated groups significantly increased dorsal horn sensory neurons compared to the CRUSH group. Data are expressed as mean ± SEM. *p < 0.05, **p < 0.01, and ***p < 0.001.
FIGURE 6
FIGURE 6
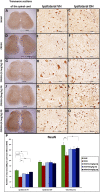
(A–O): NeuN immunoreactivity staining in the ipsilateral lumbar spinal cord regions after sciatic nerve crush injury in all experimental groups (A–O). NeuN-positive neurons are identified as brown cells (Magnification ×4 and 40x). (P) Means of labeled NeuN immunoreactive neurons/field in the spinal cord sections of rats subjected to sciatic nerve crush injury. NeuN neuronal count was less in the CRUSH group after sciatic nerve crush injury. There were no significant differences in neuronal loss in the FB-treated rats. Data are expressed as mean ± SEM. *p < 0.05, **p < 0.01, and ***p < 0.001.
FIGURE 7
FIGURE 7
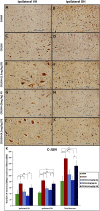
(A–J): c-Jun immunoreactive neurons in ipsilateral lumbar spinal cord segments following sciatic nerve crush injury. C-Jun-positive neurons were observed with a brown-stained nucleus in the ipsilateral ventral and dorsal grey horns (magnification ×40). (K) Number of c-Jun-positive neurons at week 4 after sciatic nerve crush surgery. The numbers of c-Jun-positive neurons increased significantly in the spinal cord’s ventral and dorsal horns in all the experimental groups following sciatic nerve crush injury compared with those in the sham-operated group. Data are expressed as mean ± SEM. *p < 0.05, **p < 0.01, and ***p < 0.001.
FIGURE 8
FIGURE 8
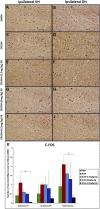
(A–J): c-Fos immunohistochemistry in the ipsilateral lumbar spinal cord regions after sciatic nerve crush injury. Weak immunoreactivity was observed in the nuclei of the spinal neurons of the CRUSH group (Magnification ×40). (K) After sciatic nerve crush injury, the number of c-Fos positive neurons in the spinal cord’s ipsilateral ventral and dorsal horns. The number of c-Fos positive neurons markedly decreased with FB treatment in the spinal cord’s anterior and dorsal horns. Data are expressed as mean ± SEM. *p < 0.05, **p < 0.01, and ***p < 0.001.
FIGURE 9
FIGURE 9
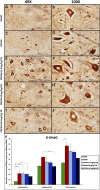
(A–J): Representative immunohistochemical staining of 8-OHdG in the ventral horn segment of the spinal cord after sciatic nerve crush injury. 8-OHdG positive neurons were identified with brown nuclei among all experimental groups (Magnification ×40 and 100x). (K) After sciatic nerve crush injury, the number of positive neurons for 8-OHdG in the spinal cord’s ipsilateral ventral and dorsal horns. 8-OHdG positive neurons were highly identified in the ventral horn of the spinal cord in the CRUSH group after injury. FB-treated groups showed lower 8-OHdG expression in the spinal cord when compared to the CRUSH group. Data are expressed as mean ± SEM. *p < 0.05, **p < 0.01, and ***p < 0.001.
FIGURE 10
FIGURE 10
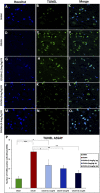
FB reduced apoptosis after sciatic nerve crush injury. The apoptotic cells of the spinal cord were identified through a TUNEL assay. (B, E, H, K, and N) Cells with a TUNEL signal are presented in (green) and counterstained with Hoechst in (A, D, G, J and M) (blue). (C,F,I,L,O) photos representing merged Hoechst and TUNEL immunopfluorescence staining Magnification ×40. (P) The number of TUNEL-positive cells within the spinal cord. CRUSH animals demonstrated a higher number of TUNEL-positive cells when compared to other experimental groups. FB treatment significantly decreased the number of apoptotic cells after sciatic nerve crush injury. Data are expressed as mean ± SEM. *p < 0.05, **p < 0.01, and ***p < 0.001.
FIGURE 11
FIGURE 11
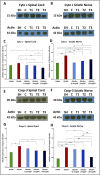
(A–D): FB inhibits cytochrome c release after sciatic nerve crush injury. After the injury, spinal cord samples at week 4 after injury were processed for Western blot analysis. Western blot analysis of cytochrome c with cytoplasmic fractions in the spinal cord (A and C) and sciatic nerve (B and D) samples after injury. (C, D) Quantitative Western blotting analysis shows that FB treatment significantly decreased cytochrome c release into cytoplasm compared with the CRUSH group after injury. Data are expressed as mean ± SEM. *p < 0.05, **p < 0.01, and ***p < 0.001.(E–H): FB inhibits caspase-3 activation after sciatic nerve crush injury. Western blot analysis of activated caspase-3 in the spinal cord (E and G) and sciatic nerve (F and H) samples after injury. (C, D) Quantitative Western blotting analysis (C, D) shows that the active caspase-3 was increased in the CRUSH group after sciatic nerve crush injury. FB treatment significantly decreased the level of activated caspase-3 compared with the CRUSH group after injury. Data are expressed as mean ± SEM. *p < 0.05, **p < 0.01, and ***p < 0.001.
FIGURE 12
FIGURE 12
(A–D): FB inhibits neuronal apoptosis after sciatic nerve crush injury. The expression levels of Bax in the spinal cord neurons (A and C) and sciatic nerve (B and D) were detected using Western blot analysis at week 4 after sciatic nerve crush injury. (C, D) Quantitative analysis of Western blotting shows increased Bax expression levels in the CRUSH group after injury. However, Bax expression levels were significantly decreased in FB treatment groups compared to the CRUSH group. Data are expressed as mean ± SEM. *p < 0.05, **p < 0.01, and ***p < 0.001.(E–H): FB inhibits neuronal apoptosis after sciatic nerve crush injury. The expression levels of Bcl-2 in the spinal cord neurons (E and G) and sciatic nerve (F and H) were detected using Western blot analysis at week 4 after sciatic nerve crush injury. (G, H) Quantitative analysis of Western blotting shows decreased Bcl-2 expression levels in the CRUSH group after injury. However, Bcl-2 expression levels were significantly increased in FB treatment groups compared to the CRUSH group. Data are expressed as mean ± SEM. *p < 0.05, **p < 0.01, and ***p < 0.001. (I–K): The Bax/Bcl-2 ratio in the spinal cord neurons and sciatic nerve was detected using Western blot analysis at week 4 after sciatic nerve crush injury. (I) Comparison of Bax/Bcl-2 ratio on spinal cord and sciatic nerve crush injury after FB treatment. (J, K) Quantitative analysis shows decreased Bax/Bcl-2 ratio in spinal cord and sciatic nerve in all FB-treated groups compared to the CRUSH group after injury. Data are expressed as mean ± SEM. *p < 0.05, **p < 0.01, and ***p < 0.001.

Similar articles

Cited by

References

    1. Adams J. M., Cory S. (1998). The bcl-2 protein family: Arbiters of cell survival. Science 281, 1322–1326. 10.1126/science.281.5381.1322 - DOI - PubMed
    1. Al-Hassan J. M. (1990). Diabetic ulcer healing preparations from the skin of the arabian Gulf catfish (Arius bilineatus val.): A novel and effective treatment. Int. J. Tissue React. 12 (2), 121–135. - PubMed
    1. Al-Hassan J. M., Afzal M., Oommen S., Liu Y. F., Pace-Asciak C. (2022). Oxysterols in catfish skin secretions (Arius bilineatus, Val.) exhibit anti-cancer properties. Front. Pharmacol. 13, 1001067. 10.3389/fphar.2022.1001067 - DOI - PMC - PubMed
    1. Al-Hassan J. M., Dyson M., Young S. R., Thomson M., Criddle R. S. (1991). Acceleration of wound healing responses induced by preparations from the epidermal secretions of the Arabian Gulf catfish (Arius bilineatus, Valenciennes). J. Wilderness Med. 2, 153–163. 10.1580/0953-9859-2.3.153 - DOI
    1. Al-Hassan J. M., Hinek A., Renno W. M., Wang Y., Liu Y. F., Guan R., et al. (2020). Potential mechanism of dermal wound treatment with preparations from the skin gel of arabian Gulf catfish: A unique furan fatty acid (F6) and cholesta-3, 5-diene (S5) recruit neutrophils and fibroblasts to promote wound healing. Front. Pharmacol. 11, 899. 10.3389/fphar.2020.00899 - DOI - PMC - PubMed

Grants and funding

This work was supported by Kuwait University Research Administration (KU Grants No. SL03/14 and SL04/09 and RCF/OMICSRU project SRUL02/13), Kuwait Foundation for the Advancement of Sciences (Grant No. KFAS 2013-1207-01 A-C and CNN2013MM01), Graduate College, Kuwait University and JA-H for which we are grateful.