

Resveratrol suppresses lipopolysaccharide-mediated activation of osteoclast precursor RAW 264.7 cells by increasing miR-181a-5p expression
- PMID: 36723677
- PMCID: PMC9900163
- DOI: 10.1177/03946320231154995
Resveratrol suppresses lipopolysaccharide-mediated activation of osteoclast precursor RAW 264.7 cells by increasing miR-181a-5p expression
Abstract
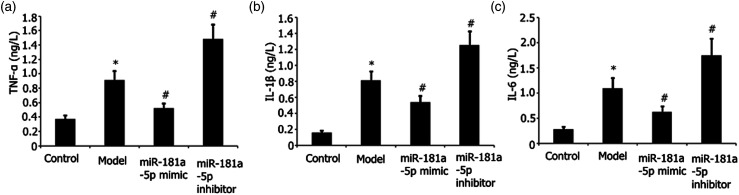
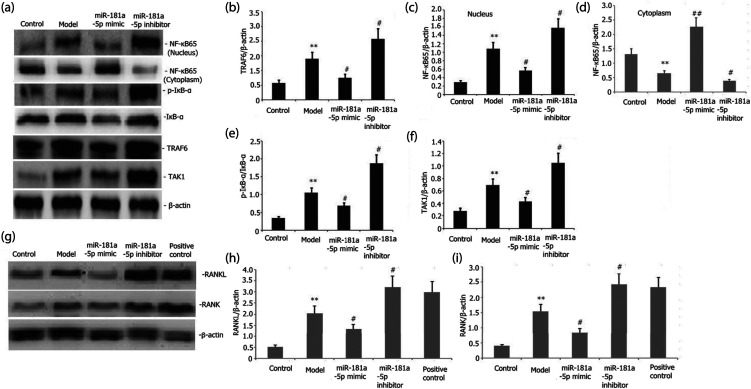
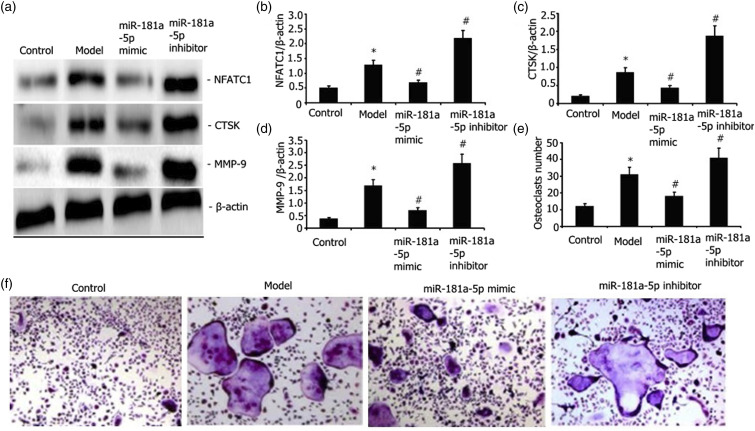
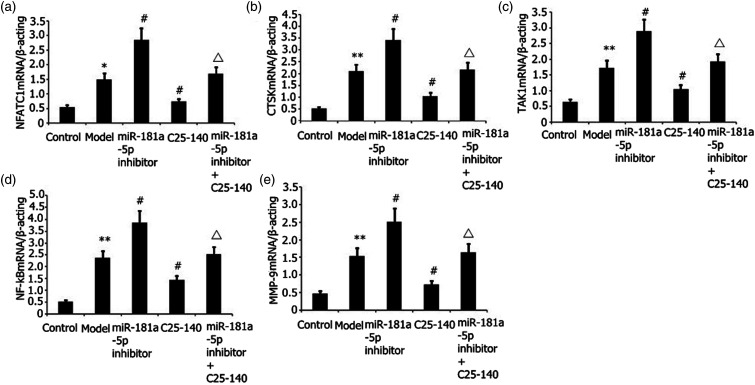
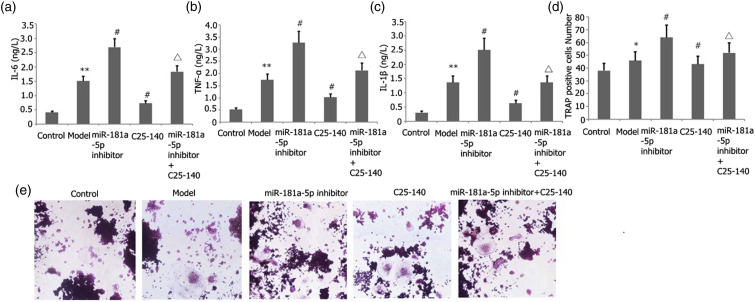
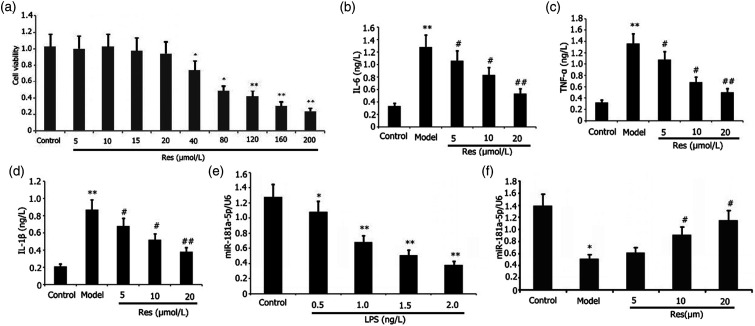
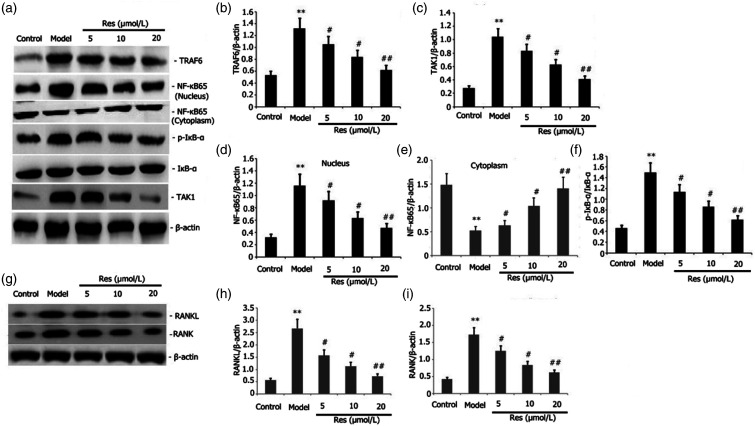
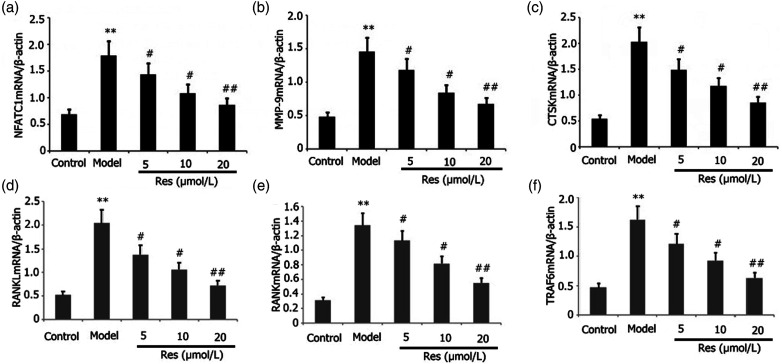
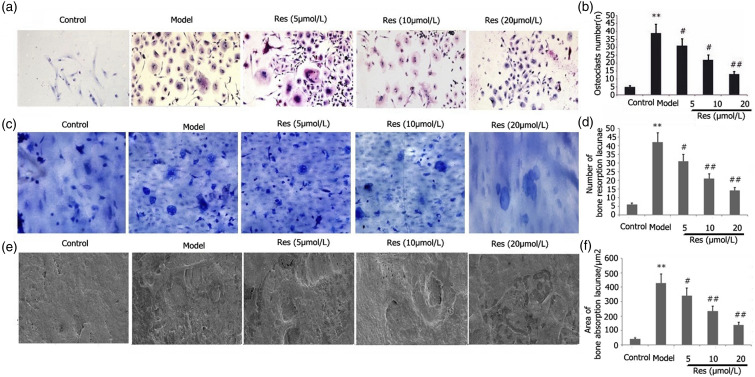
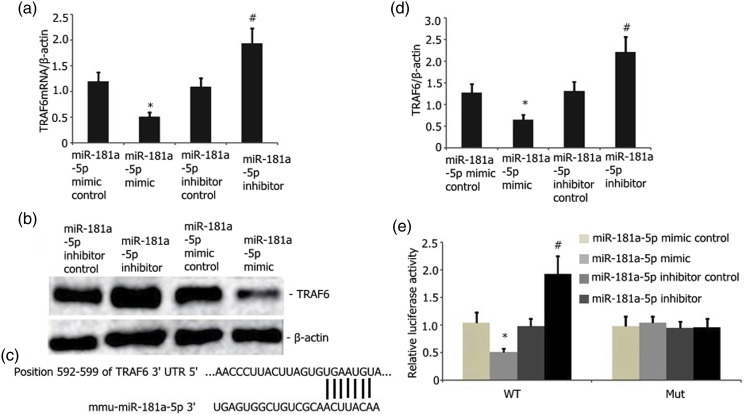
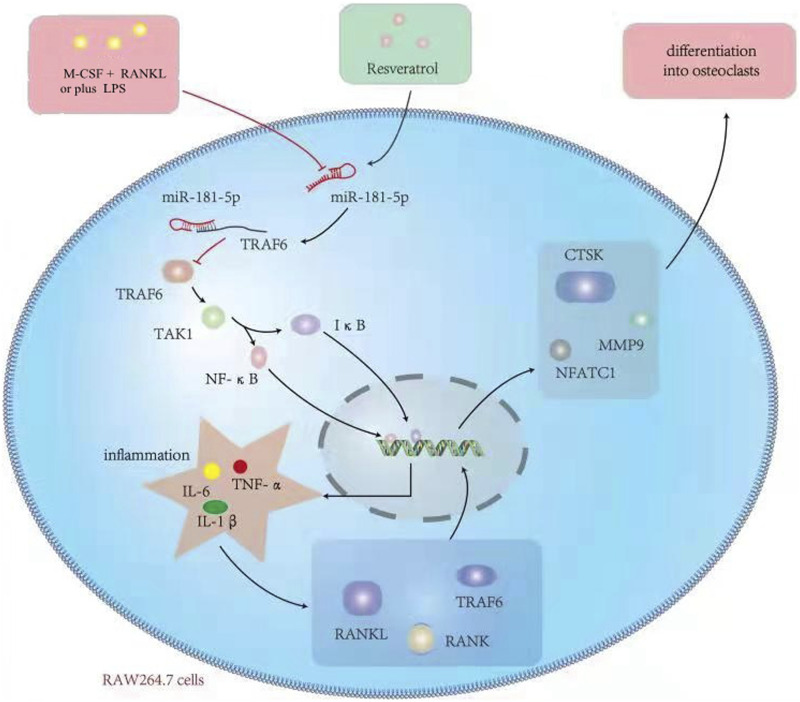
Resveratrol (Res) has anti-inflammation and antiosteoporosis functions. We evaluated the effect of Res on osteoclast differentiation by releasing inflammatory cytokines from osteoclast precursor RAW 264.7 cells stimulated by lipopolysaccharide (LPS). In the study, LPS (1 ng/L) was used to induce the Raw 264.7 inflammatory injury model in vitro. A total of 25 ng/mL M-CSF + 30 ng/mL RANKL or plus 1 μg/L LPS was used to induce osteoclastogenesis in the experiments. We utilized the Cell Counting Kit-8 assay to measure the relative cell survival of RAW 264.7 cells. Then, enzyme-linked immunosorbent assays were utilized to measure the abundance of inflammatory markers, such as interleukin-1 beta (IL-1β), tumor necrosis factor-alpha (TNF-α), and IL-6. Subsequently, Western blot analysis was applied to assess the abundance of phosphorylated transforming growth factor beta-activated kinase 1 (P-TAK1) protein, TNF receptor-associated factor 6 (TRAF6), nuclear factor-κB inhibitor protein (IκB), phosphorylated IκB-α (P-IκB-α), and nuclear factor κB65 (NF-κB65). mRNA expression levels of miR-181a-5p, TRAF6, specific gene calcitonin receptor (CTR), activated T nuclear factor 1 (NFATC1), cathepsin K (CTSK), and matrix metalloproteinase (MMP)-9 were determined via a real-time polymerase chain reaction. Osteoclast bone resorption function was determined. Finally, tartrate-resistant acid phosphatase (TRAP) staining was performed.The results found that Compared with the model group, the degrees of expressions of supernatant inflammatory factors TNF-α, IL-1β, and IL-6 were substantially attenuated in the Res treatment group (p < 0.05). Furthermore, the extent of miR-181a-5p expression in the RAW 264.7 cells significantly increased, whereas P-IκB-α, P-TAK1, NF-κB65, and TRAF6 expressions significantly decreased in the Res treatment group as opposed to the model group (p < 0.05). The CTR, NFATC1, MMP-9, CTSK, and TRAP mRNA expression levels were substantially reduced during osteoclast differentiation and bone resorption in the Res treatment group.The results suggest that Res can reduce the RAW 264.7 cell differentiation into osteoclasts and relieve LPS-stimulated osteoporosis, and the underlying mechanism may be associated with the Res-inhibited activity of the TRAF6/TAK1 pathway through the increased miR-181a-5p expression.
Keywords: lipopolysaccharide; miR-181a-5p; osteoclast; raw 264.7 cells; resveratrol.
Conflict of interest statement
The author(s) declared no potential conflicts of interest with respect to the research, authorship, and/or publication of this article.
Figures
Similar articles
-
Resveratrol protects BV2 mouse microglial cells against LPS-induced inflammatory injury by altering the miR-146a-5p/TRAF6/NF-κB axis.Immunopharmacol Immunotoxicol. 2019 Oct;41(5):549-557. doi: 10.1080/08923973.2019.1666406. Epub 2019 Sep 18. Immunopharmacol Immunotoxicol. 2019. PMID: 31530042
-
Monotropein Protects against Inflammatory Bone Loss and Suppresses Osteoclast Formation and Bone Resorption by Inhibiting NFATc1 via NF-κB and Akt/GSK-3β Pathway.Nutrients. 2022 Sep 24;14(19):3978. doi: 10.3390/nu14193978. Nutrients. 2022. PMID: 36235631 Free PMC article.
-
Sesquiterpene lactone parthenolide blocks lipopolysaccharide-induced osteolysis through the suppression of NF-kappaB activity.J Bone Miner Res. 2004 Nov;19(11):1905-16. doi: 10.1359/JBMR.040919. Epub 2004 Sep 27. J Bone Miner Res. 2004. PMID: 15476591
-
The Role of Rosavin in the Pathophysiology of Bone Metabolism.Int J Mol Sci. 2024 Feb 9;25(4):2117. doi: 10.3390/ijms25042117. Int J Mol Sci. 2024. PMID: 38396794 Free PMC article. Review.
-
Effect of Bifidobacterium on osteoclasts: TNF-α/NF-κB inflammatory signal pathway-mediated mechanism.Front Endocrinol (Lausanne). 2023 Mar 9;14:1109296. doi: 10.3389/fendo.2023.1109296. eCollection 2023. Front Endocrinol (Lausanne). 2023. PMID: 36967748 Free PMC article. Review.
Cited by
-
Microbiota and Resveratrol: How Are They Linked to Osteoporosis?Cells. 2024 Jul 3;13(13):1145. doi: 10.3390/cells13131145. Cells. 2024. PMID: 38994996 Free PMC article. Review.
-
CX3CL1 promotes M1 macrophage polarization and osteoclast differentiation through NF-κB signaling pathway in ankylosing spondylitis in vitro.J Transl Med. 2023 Aug 25;21(1):573. doi: 10.1186/s12967-023-04449-0. J Transl Med. 2023. PMID: 37626378 Free PMC article.
References
-
- Blaschke M, Koepp R, Cortis J, et al. (2018) IL-6, IL-1β, and TNF-α only in combination influence the osteoporotic phenotype in Crohn’s patients via bone formation and bone resorption. Advances in Clinical and Experimental Medicine 27(1): 45–56. - PubMed
-
- Lou J, Wang YL, Zhang ZM, et al. (2017) MiR-20b inhibits mycobacterium tuberculosis induced inflammation in the lung of mice through targeting NLRP3. Experimental Cell Research 358(2): 120–128. - PubMed
-
- Xu LJ, Wang QX, Wei Jiang W, et al. (2019) MiR-34c Ameliorates Neuropathic Pain by Targeting NLRP3 in a Mouse Model of Chronic Constriction Injury. Neuroscience 399: 125–134. - PubMed
MeSH terms
Substances
LinkOut - more resources
Full Text Sources
Research Materials
Miscellaneous
