

Comparative analysis of the relationship between four hepatic steatosis indices and muscle mass
- PMID: 36717652
- PMCID: PMC9886852
- DOI: 10.1038/s41598-023-28751-5
Comparative analysis of the relationship between four hepatic steatosis indices and muscle mass
Abstract
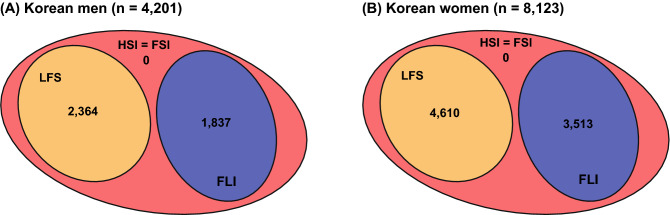
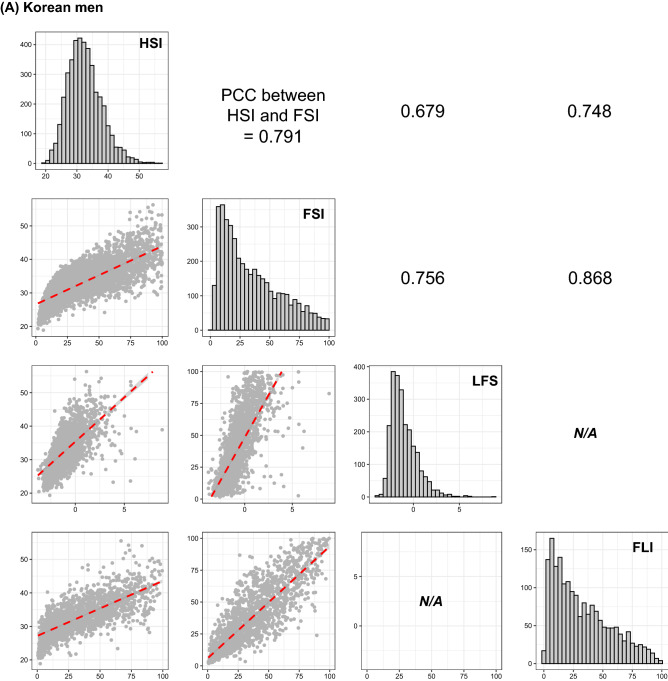
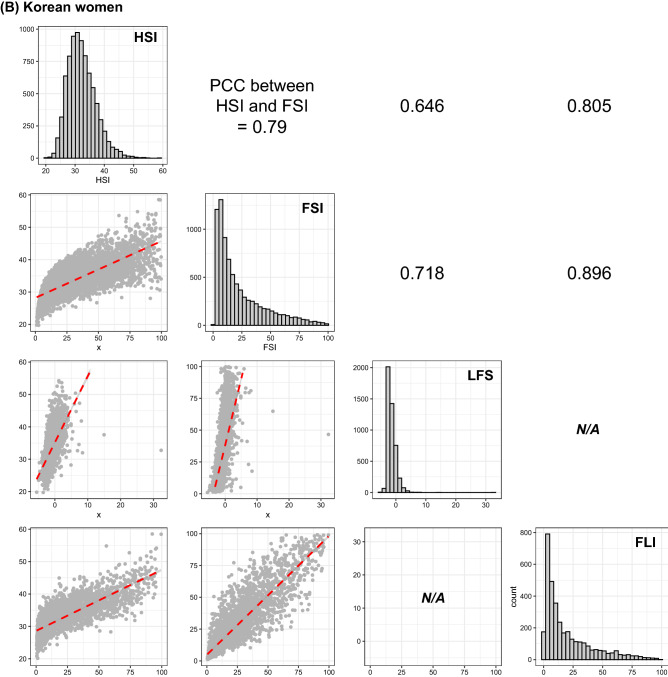
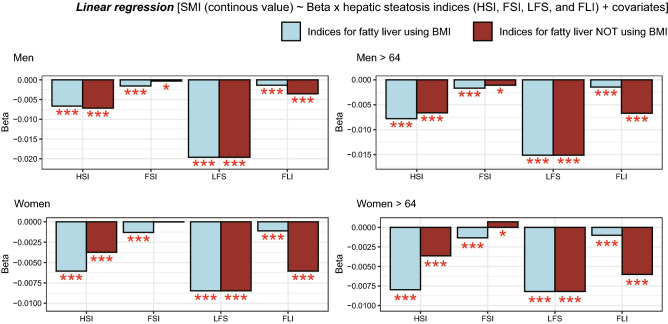
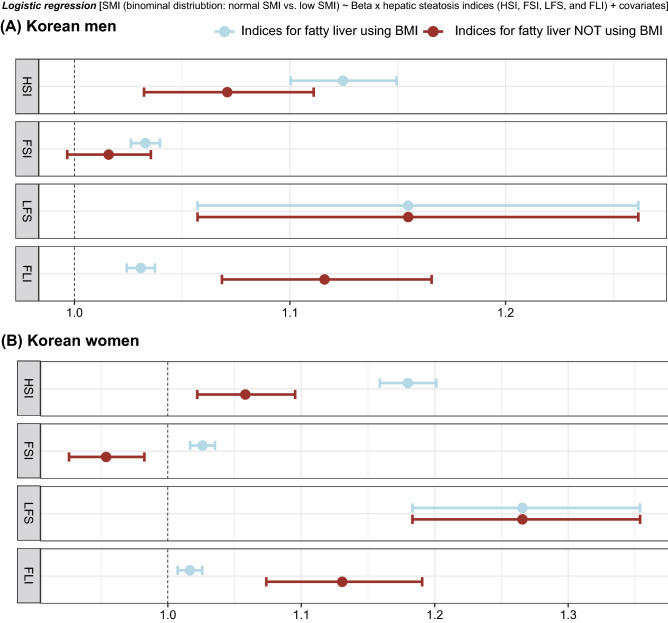
Several studies have attempted to validate the relationship between hepatic steatosis and sarcopenia. The crucial limitation is to establish the status of hepatic steatosis by costly or invasive methods. Therefore, several models predicting non-alcoholic fatty liver disease (NAFLD) have been developed but have exhibited heterogeneous results. In this study, we aimed to review and compare four representative models and analyze their relationship with the risk of low muscle mass. Korea National Health and Nutrition Examination Surveys from 2008 to 2011 were used to confirm our hypothesis. Dual-energy X-ray absorptiometry was used to measure the amount of skeletal muscle mass. We used four hepatic steatosis indices: hepatic steatosis index (HSI), Framingham steatosis index (FSI), liver fat score (LFS), and fatty liver index (FLI). Multivariate linear and logistic regressions were used to reveal the relationship between NAFLD and low skeletal muscle index (LSMI). Pairs of FSI-FLI and HSI-FLI exhibited the best and second-best correlations among all possible pairs. The four hepatic steatosis models were associated with increased risk for LSMI. After removing the body mass index effect, HSI and FLI remained robust predictors for LSMI. NAFLD was a significant and potent risk factor for low skeletal muscle.
© 2023. The Author(s).
Conflict of interest statement
The authors declare no competing interests.
Figures
Similar articles
-
Low skeletal muscle mass is associated with non-alcoholic fatty liver disease in Korean adults: the Fifth Korea National Health and Nutrition Examination Survey.Hepatobiliary Pancreat Dis Int. 2016 Feb;15(1):39-47. doi: 10.1016/s1499-3872(15)60030-3. Hepatobiliary Pancreat Dis Int. 2016. PMID: 26818542
-
Association of Hepatic Steatosis Index and Fatty Liver Index with Carotid Atherosclerosis in Type 2 Diabetes.Int J Med Sci. 2021 Jul 23;18(14):3280-3289. doi: 10.7150/ijms.62010. eCollection 2021. Int J Med Sci. 2021. PMID: 34400897 Free PMC article.
-
Sarcopenia Is an Independent Risk Factor for NAFLD in COPD: A Nationwide Survey (KNHANES 2008-2011).Int J Chron Obstruct Pulmon Dis. 2020 May 7;15:1005-1014. doi: 10.2147/COPD.S249534. eCollection 2020. Int J Chron Obstruct Pulmon Dis. 2020. PMID: 32440112 Free PMC article.
-
Skeletal muscle mass and abdominal obesity are independent predictors of hepatic steatosis and interact to predict ten-year cardiovascular disease incidence: Data from the ATTICA cohort study.Clin Nutr. 2022 Jun;41(6):1281-1289. doi: 10.1016/j.clnu.2022.03.022. Epub 2022 Mar 31. Clin Nutr. 2022. PMID: 35504171
-
Sarcopaenia is associated with NAFLD independently of obesity and insulin resistance: Nationwide surveys (KNHANES 2008-2011).J Hepatol. 2015 Aug;63(2):486-93. doi: 10.1016/j.jhep.2015.02.051. Epub 2015 Mar 12. J Hepatol. 2015. PMID: 25772036
References
-
- Saggini, R., Carmignano, S., Cosenza, L., Palermo, T. & Bellomo, R. G. Sarcopenia in chronic illness and rehabilitative approaches. in Frailty and Sarcopenia-Onset, Development and Clinical Challenges (2017).
Publication types
MeSH terms
LinkOut - more resources
Full Text Sources
Medical
