

Second hit impels oncogenesis of retinoblastoma in patient-induced pluripotent stem cell-derived retinal organoids: direct evidence for Knudson's theory
- PMID: 36714839
- PMCID: PMC9802398
- DOI: 10.1093/pnasnexus/pgac162
Second hit impels oncogenesis of retinoblastoma in patient-induced pluripotent stem cell-derived retinal organoids: direct evidence for Knudson's theory
Abstract
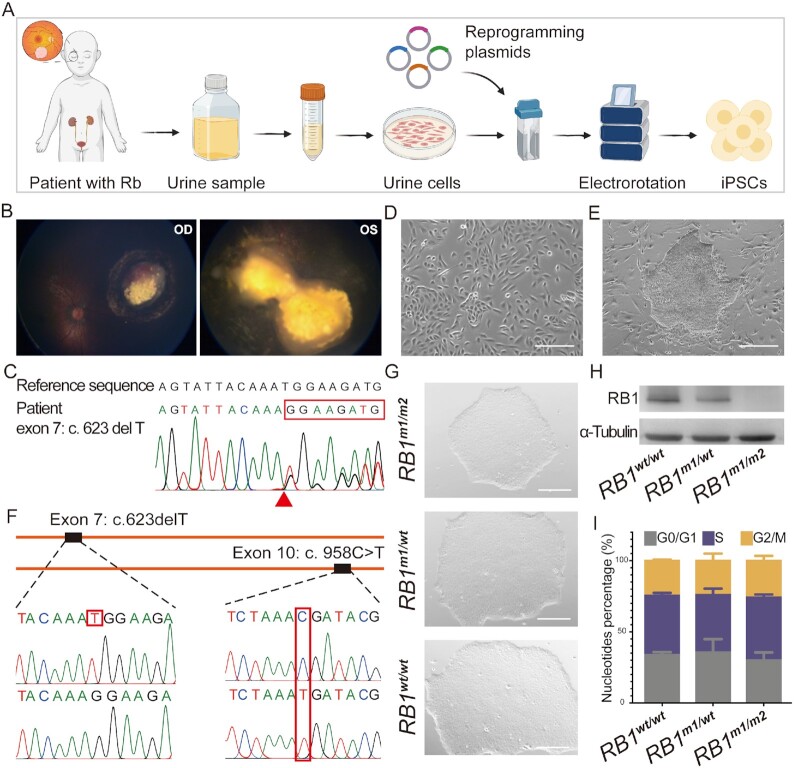
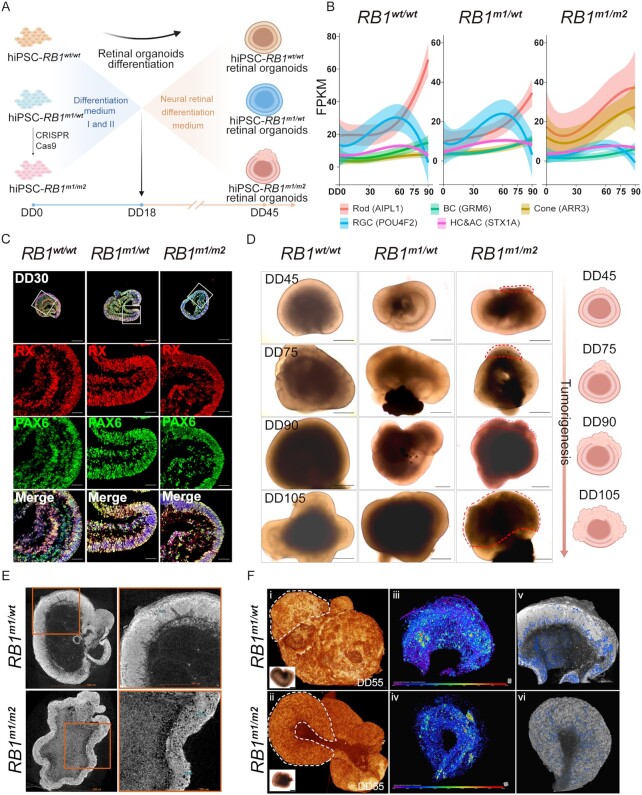
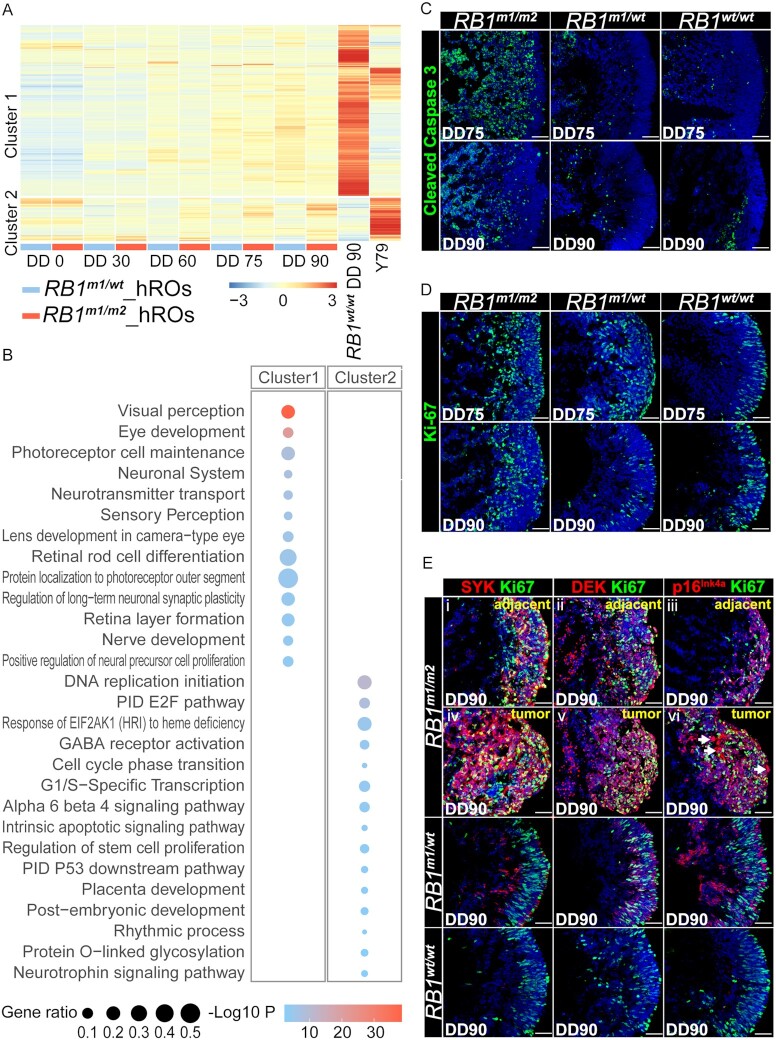
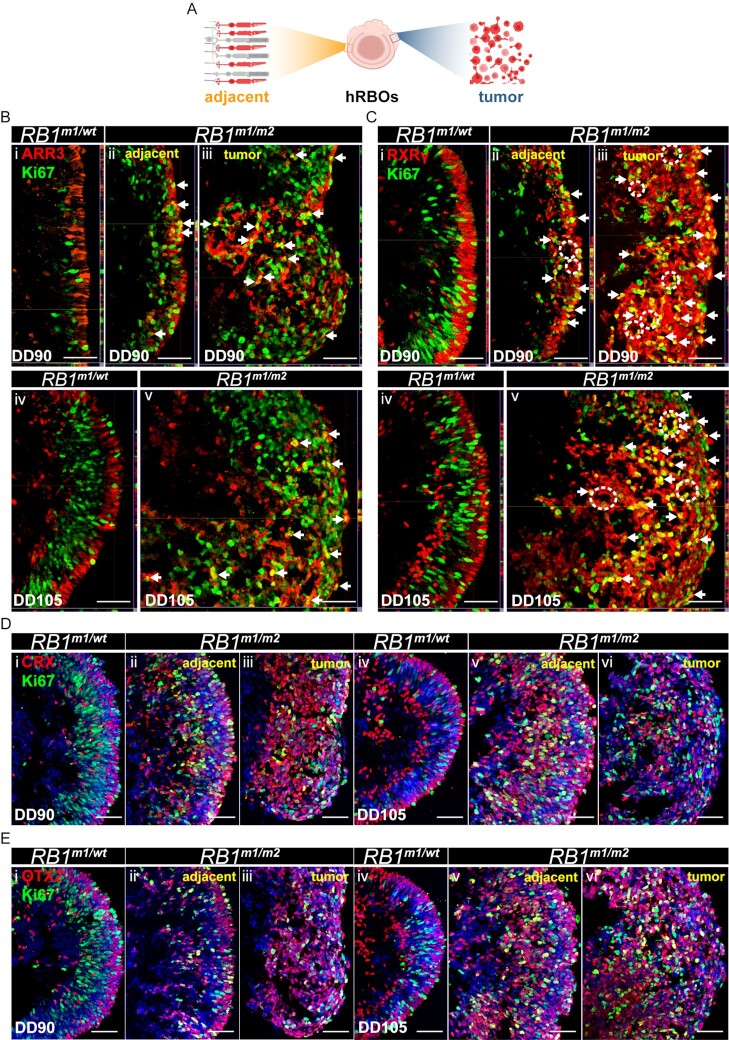
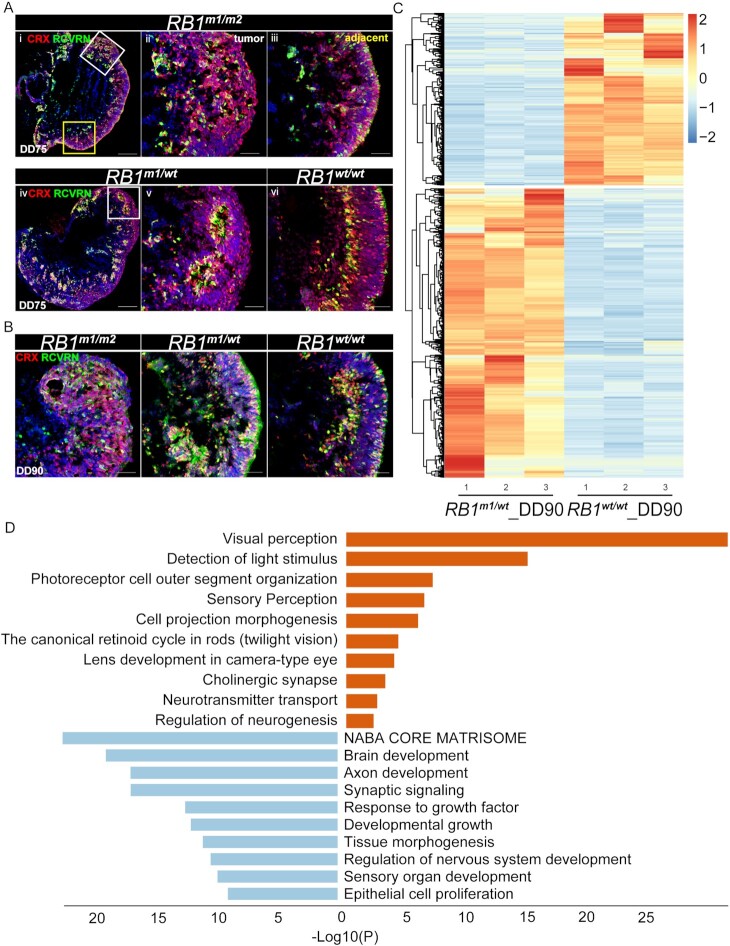
Retinoblastoma (Rb) is a type of malignant tumor due to abnormal retinogenesis with biallelic mutations of the RB1 gene. Its pathogenesis has been proposed as a "two-mutation hypothesis" by Knudson since 1971; however, there remain some debates on disease onset sufficiency of the biallelic RB1 mutations. To obtain straightforward evidence for this hypothesis, we investigated whether two-hit mutations of the RB1 gene drive tumorigenesis in patient-induced pluripotent stem cell (hiPSC)-derived human retinal organoids (hROs) and whether single allelic mutation hiPSC-derived hROs exhibit molecular and cellular defects. We generated hiPSCs with a heterozygous germline mutation (RB1m1/ wt ) from a Rb patient. A second-allele RB1 gene mutation was knocked in to produce compound heterozygous mutations (RB1m1/m2 ) in the hiPSCs. These two hiPSC lines were independently developed into hROs through a stepwise differentiation. The hiPSC-RB1m1/m2 derived organoids demonstrated tumorigenesis in dishes, consistent with Rb profiles in spatiotemporal transcriptomes, in which developmentally photoreceptor fate-determining markers, CRX and OTX2, were highly expressed in hiPSC-RB1m1/m2 derived hROs. Additionally, ARR3+ maturing cone precursors were co-labeled with proliferative markers Ki67 or PCNA, in agreement with the consensus that human Rb is originated from maturing cone precursors. Finally, we demonstrated that retinal cells of hROs with monoallelic RB1 mutation were abnormal in molecular aspects due to its haploinsufficiency. In conclusion, this study provides straightforward supporting evidence in a way of reverse genetics for "two-hit hypothesis" in the Rb tumorigenesis and opens new avenues for development of early intervention and treatment of Rb.
Keywords: RB1; iPS cells; retinal organoids; retinoblastoma; two-mutation hypothesis.
© The Author(s) 2022. Published by Oxford University Press on behalf of the National Academy of Sciences.
Figures
Similar articles
-
pRB-Depleted Pluripotent Stem Cell Retinal Organoids Recapitulate Cell State Transitions of Retinoblastoma Development and Suggest an Important Role for pRB in Retinal Cell Differentiation.Stem Cells Transl Med. 2022 Apr 29;11(4):415-433. doi: 10.1093/stcltm/szac008. Stem Cells Transl Med. 2022. PMID: 35325233 Free PMC article.
-
Role of RB1 in human embryonic stem cell-derived retinal organoids.Dev Biol. 2020 Jun 15;462(2):197-207. doi: 10.1016/j.ydbio.2020.03.011. Epub 2020 Mar 19. Dev Biol. 2020. PMID: 32197890 Free PMC article.
-
Human embryonic stem cell-derived organoid retinoblastoma reveals a cancerous origin.Proc Natl Acad Sci U S A. 2020 Dec 29;117(52):33628-33638. doi: 10.1073/pnas.2011780117. Epub 2020 Dec 14. Proc Natl Acad Sci U S A. 2020. PMID: 33318192 Free PMC article.
-
Molecular biology of retinoblastoma.Clin Transl Oncol. 2008 Jul;10(7):389-94. doi: 10.1007/s12094-008-0220-y. Clin Transl Oncol. 2008. PMID: 18628066 Review.
-
The Biology of Retinoblastoma.Prog Mol Biol Transl Sci. 2015;134:503-16. doi: 10.1016/bs.pmbts.2015.06.012. Epub 2015 Jul 14. Prog Mol Biol Transl Sci. 2015. PMID: 26310174 Review.
Cited by
-
Targeted lipidomics uncovers oxylipin perturbations and potential circulation biomarkers in Bietti's crystalline dystrophy.Graefes Arch Clin Exp Ophthalmol. 2024 Dec;262(12):3773-3786. doi: 10.1007/s00417-024-06554-2. Epub 2024 Jul 4. Graefes Arch Clin Exp Ophthalmol. 2024. PMID: 38963460
-
Retinal Organoids from Induced Pluripotent Stem Cells of Patients with Inherited Retinal Diseases: A Systematic Review.Stem Cell Rev Rep. 2025 Jan;21(1):167-197. doi: 10.1007/s12015-024-10802-7. Epub 2024 Oct 18. Stem Cell Rev Rep. 2025. PMID: 39422807 Free PMC article. Review.
-
Advanced Cellular Models for Rare Disease Study: Exploring Neural, Muscle and Skeletal Organoids.Int J Mol Sci. 2024 Jan 13;25(2):1014. doi: 10.3390/ijms25021014. Int J Mol Sci. 2024. PMID: 38256087 Free PMC article. Review.
-
The apoptotic and anti-proliferative effect of Lysyl oxidase propeptide in Y79 human retinoblastoma cells.Mol Vis. 2023 Aug 14;29:125-139. eCollection 2023. Mol Vis. 2023. PMID: 38222455 Free PMC article.
-
Pediatric Tumors as Disorders of Development: The Case for In Vitro Modeling Based on Human Stem Cells.Cancer Control. 2024 Jan-Dec;31:10732748241270564. doi: 10.1177/10732748241270564. Cancer Control. 2024. PMID: 39118322 Free PMC article. Review.
References
LinkOut - more resources
Full Text Sources
Miscellaneous
