[Preprint]. 2023 Jan 13:2023.01.13.523698.
doi: 10.1101/2023.01.13.523698.

The mitochondrial multi-omic response to exercise training across tissues

Affiliations

The mitochondrial multi-omic response to exercise training across tissues

David Amar et al. bioRxiv. .

Update in

  • The mitochondrial multi-omic response to exercise training across rat tissues.
    Amar D, Gay NR, Jimenez-Morales D, Jean Beltran PM, Ramaker ME, Raja AN, Zhao B, Sun Y, Marwaha S, Gaul DA, Hershman SG, Ferrasse A, Xia A, Lanza I, Fernández FM, Montgomery SB, Hevener AL, Ashley EA, Walsh MJ, Sparks LM, Burant CF, Rector RS, Thyfault J, Wheeler MT, Goodpaster BH, Coen PM, Schenk S, Bodine SC, Lindholm ME; MoTrPAC Study Group. Amar D, et al. Cell Metab. 2024 Jun 4;36(6):1411-1429.e10. doi: 10.1016/j.cmet.2023.12.021. Epub 2024 May 2. Cell Metab. 2024. PMID: 38701776

Abstract

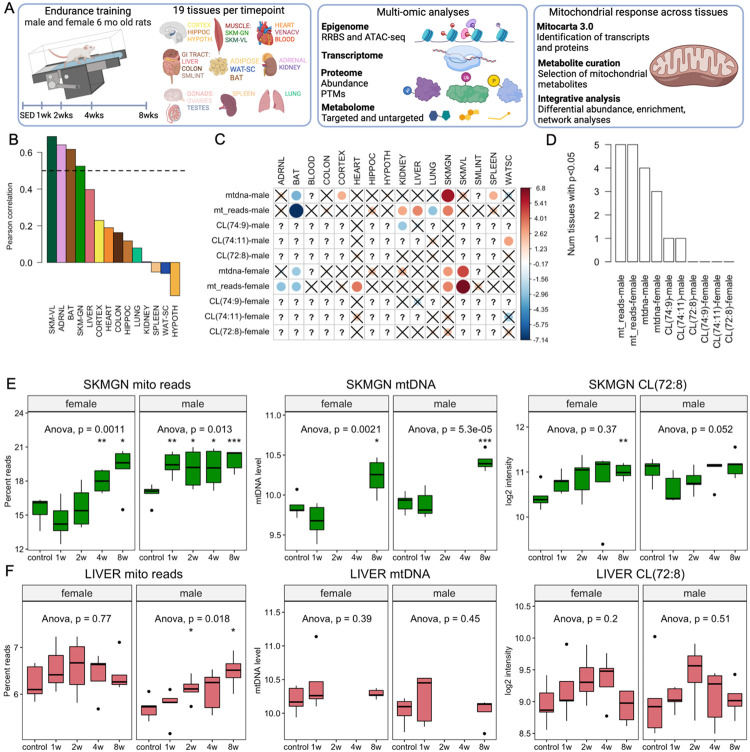
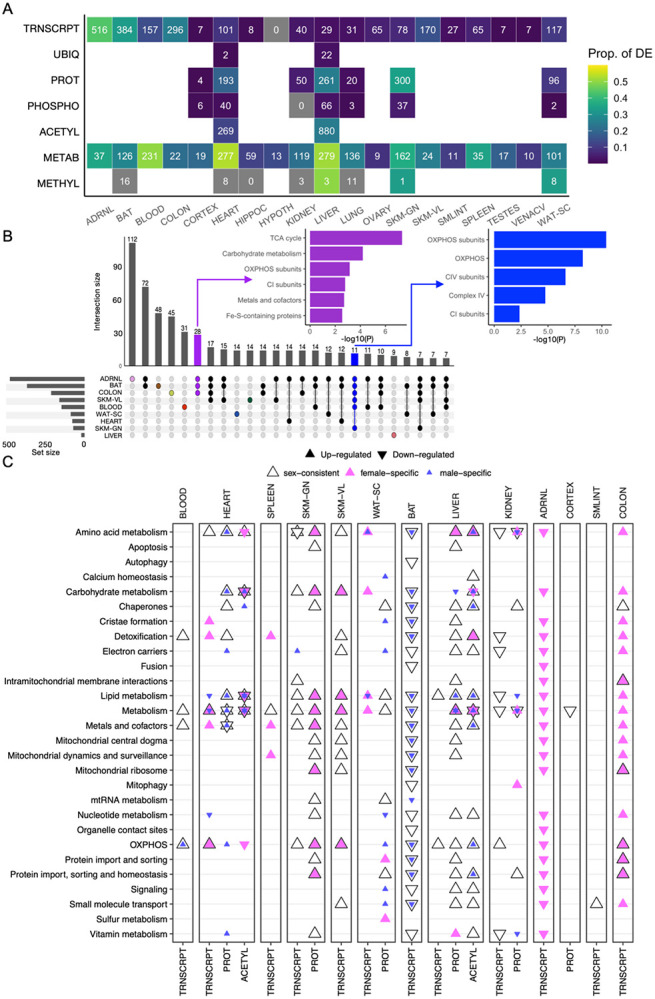
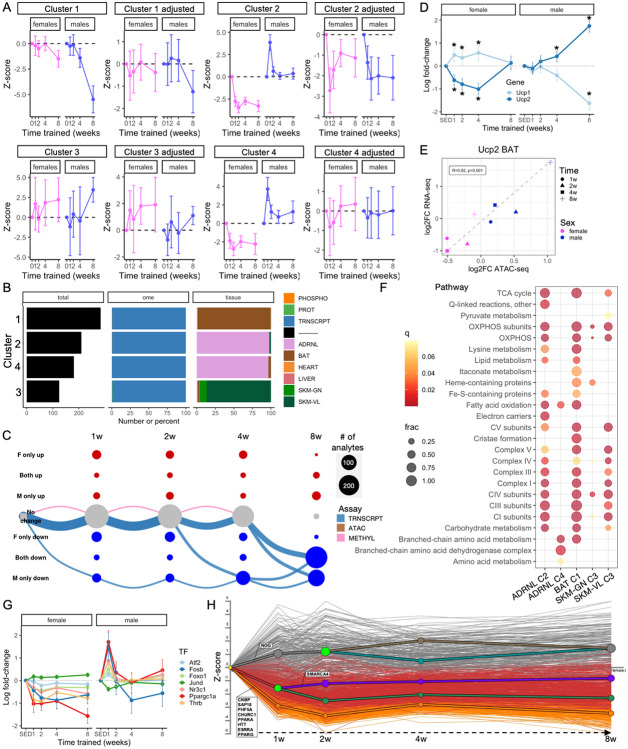
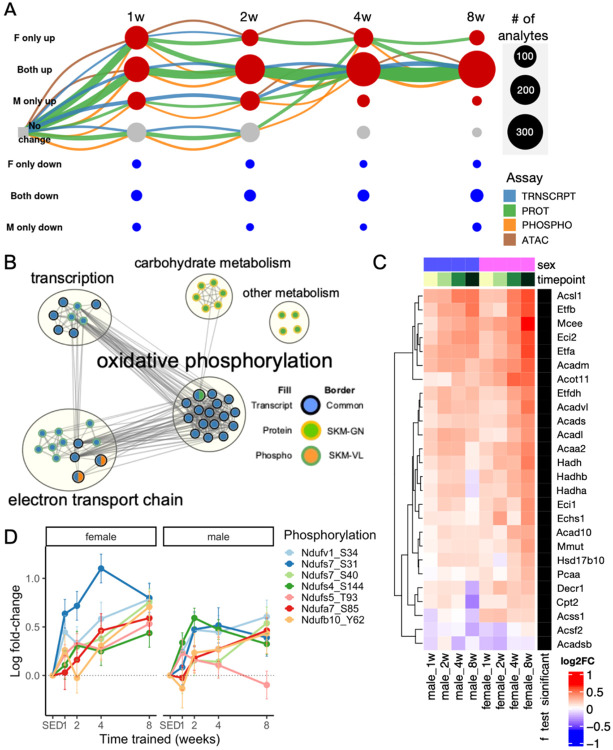
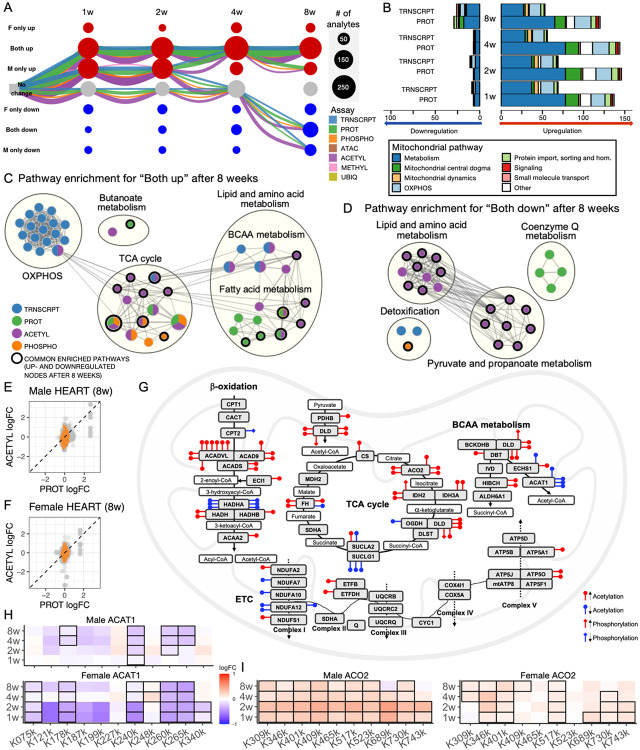
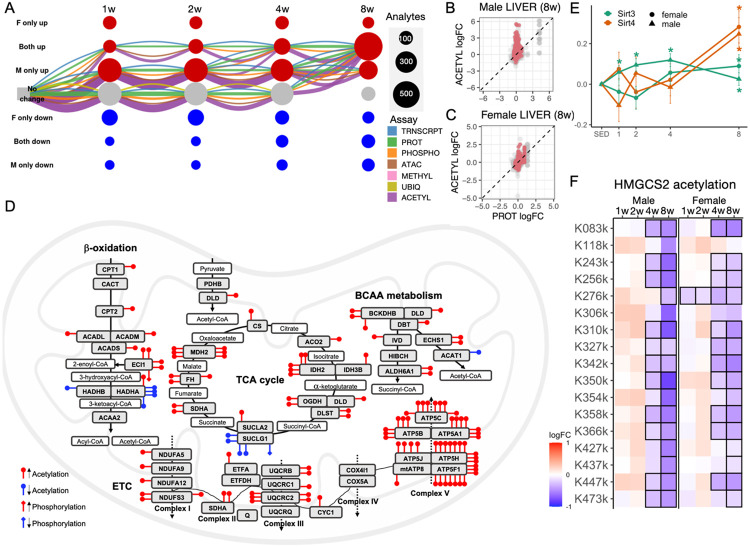
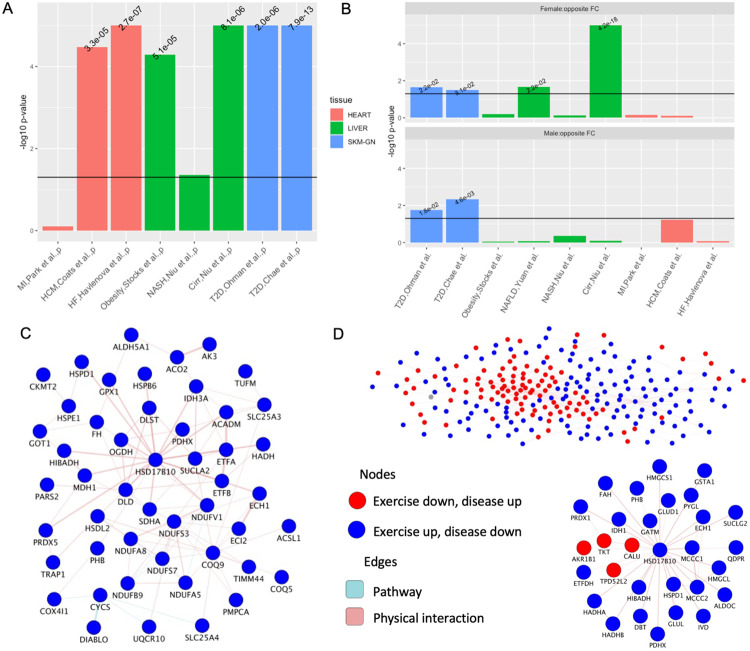
Mitochondria are adaptable organelles with diverse cellular functions critical to whole-body metabolic homeostasis. While chronic endurance exercise training is known to alter mitochondrial activity, these adaptations have not yet been systematically characterized. Here, the Molecular Transducers of Physical Activity Consortium (MoTrPAC) mapped the longitudinal, multi-omic changes in mitochondrial analytes across 19 tissues in male and female rats endurance trained for 1, 2, 4 or 8 weeks. Training elicited substantial changes in the adrenal gland, brown adipose, colon, heart and skeletal muscle, while we detected mild responses in the brain, lung, small intestine and testes. The colon response was characterized by non-linear dynamics that resulted in upregulation of mitochondrial function that was more prominent in females. Brown adipose and adrenal tissues were characterized by substantial downregulation of mitochondrial pathways. Training induced a previously unrecognized robust upregulation of mitochondrial protein abundance and acetylation in the liver, and a concomitant shift in lipid metabolism. The striated muscles demonstrated a highly coordinated response to increase oxidative capacity, with the majority of changes occurring in protein abundance and post-translational modifications. We identified exercise upregulated networks that are downregulated in human type 2 diabetes and liver cirrhosis. In both cases HSD17B10, a central dehydrogenase in multiple metabolic pathways and mitochondrial tRNA maturation, was the main hub. In summary, we provide a multi-omic, cross-tissue atlas of the mitochondrial response to training and identify candidates for prevention of disease-associated mitochondrial dysfunction.


Figures

Figure 1.
Figure 1.. Training-induced changes in biomarkers of mitochondrial volume.
A) Overview of the experimental design. Fischer 344 rats were subjected to a progressive treadmill training protocol. 19 tissues were collected from male and female rats that remained sedentary (SED) or completed 1, 2, 4, or 8 weeks of exercise training (tissues were harvested 48 hours after the last exercise bout). The tissues were assayed for epigenomics (8 tissues), transcriptomics (19 tissues), proteomics (7 tissues), post-translational modifications (phosphoproteome on 7 tissues and acetylome on 2 tissues), and metabolomics (19 tissues). Mitochondria-associated transcripts and proteins were selected using MitoCarta 3.0 and mitochondrial metabolites from a previously published dataset (ref. 24). HIPPOC = Hippocampus, HYPOTH = Hypothalamus, SMLINT = Small Intestine, SKM-GN = Gastrocnemius Skeletal Muscle, SKM-VL = Vastus Lateralis Skeletal Muscle, WAT-SC = Subcutaneous White Adipose Tissue, BAT = Brown Adipose Tissue, VENACV = Vena Cava. Created using BioRender.com. B) Correlation between mtDNA quantification and the percentage of mitochondrial RNA-seq reads across tissues. Dashed line represents rho=0.5. C) Training response of biomarkers of mitochondrial volume after 8 weeks of training. Cells marked with X are not significant (p>0.05). Cells marked with a ? represent tissues in which the biomarker was not assessed. Color scale is proportional to the ANOVA-test z-score. D) Comparison of the number of significant training responses of the mitochondrial biomarkers (p<0.05). E-F) Visualization of biomarker data in SKM-GN (E), and liver (F). Each boxplot represents the abundance level in a specific sex and time group. ANOVA statistics are provided for each tissue and sex combination. The whiskers extend from the hinge to the largest and lowest values, but no further than 1.5 * (the interquartile range).
Figure 2.
Figure 2.. The multi-omic mitochondrial response to training across tissues.
A) Heatmap of the number of mitochondria-associated analytes that significantly changed in abundance over the training time course in at least one sex (5% FDR). Each cell represents results for a single tissue and data type. Numbers indicate the number of training-differential mitochondrial analytes and colors indicate the proportion of measured analytes identified in MitoCarta that are differential. B) UpSet plot of the training-differential MitoCarta transcripts across tissues. Numbers above vertical bars indicate the number of transcripts differentially regulated by training in the tissues indicated by connected points below the bar. Horizontal bars indicate the total number of differential transcripts in each tissue. Pathway enrichment results using the MitoCarta pathways are shown for the colored bars; purple represents the 28 differential genes that were common in the adrenal glands, BAT and colon, whereas the blue bar represents 11 differential genes that were common among six tissues. C) MitoCarta pathway enrichments for the 8-week training timepoint in the 9 tissues that showed the greatest mitochondrial training response. The 8-week male and female differential transcripts were identified using our graphical analysis (see Methods). The plot shows the top pathway from each MitoCarta subcategory with the greatest number of enrichments. This was determined by taking the sum-of-log combined p-value per tissue and pathway. Each point represents a significant pathway enrichment in a given node, where the direction of the triangle indicates the direction of the training effect (up or down) and the color indicates the corresponding sex (blue = male, pink = female, black triangle indicates sex-consistent enrichment).
Figure 3.
Figure 3.. Changes in mitochondrial volume partially explain the training response in the adrenal gland and brown adipose tissue.
A) Clustering analysis showing patterns affected by adjustment for biomarkers of mitochondrial volume. B) Characteristics of the clusters in A. Number of total analytes, distribution across –omes and tissues is illustrated for each cluster. C) Graphical representation of the mitochondria-associated training-differential analytes in brown adipose tissue (BAT). Each node represents one of nine possible states (row labels, with F for females and M for males, seven states shown) at each of the four sampled training time points (column labels). Edges are drawn between nodes to represent the path of differential analytes over the training time course, with color representing the –ome. This graph includes the five largest paths for the BAT. Both node and edge size are proportional to the number of analytes represented by the node or edge. D) Gene expression changes (log2 fold-change) of Ucp1 and Ucp2 in females (left) and males (right). * indicates significant timewise change (FDR<0.05). E) Correlation between changes (log2 fold-change) in Ucp2 expression and chromatin accessibility (intronic region of UCP2, chr1:165508254-165509507). Each point represents the average for n=5 animals assayed for that timepoint and sex. F) Pathway enrichment analysis of the clusters affected by mitochondrial volume from A using the MitoCarta 3.0 Pathways. Color indicates significance of the enrichment (q-value) and size indicates fraction of analytes in the cluster that is part of the pathway. G) Gene expression changes (log2 fold-change) of examples of known PPARGC1A interactors. All are significantly upregulated in males after 1 week and downregulated in females after 8 weeks, with exception of Jund, which is significantly regulated in the opposite directions (FDR<0.05). H) Dynamic regulatory events miner (DREM) analysis results of the MitoCarta genes in female adrenal gland predict several transcription factors to be involved in the early (1w) responses.
Figure 4.
Figure 4.. Endurance training induces largely sex-consistent increases in metabolic protein abundance in skeletal muscle.
A) The dynamics of the molecular training response visualized by constructing a summary graph in which rows represent nine combined states (row labels, with F for females and M for males, seven states shown) and columns represent the four training time points. Nodes correspond to a combination of time, sex, and state. An edge connects two nodes from adjacent time points, representing a local temporal pattern, with edge color representing the –ome. The differential abundance trajectory of any given training-regulated analyte is represented by drawing a path through the nodes in this graph. This graph represents the mitochondria-associated training-differential analytes in the gastrocnemius (SKM-GN). This graph includes the five largest trajectories (by number of analytes). Both node and edge size are proportional to the number of analytes represented by the node or edge. B) Network view of pathway enrichment results corresponding to the analytes of the week 8, sex-consistent upregulation nodes in SKM-GN (A) and SKM-VL. Nodes indicate significantly enriched pathways (10% FDR), and an edge represents a pair of nodes with a similarity score of at least 0.3 between the gene sets driving each pathway enrichment. Node fill color indicates for which –ome or –omes a pathway is significant, while border color indicates if the pathway is significant in one or both skeletal muscle tissues. Node size is proportional to the number of differential analyte sets (e.g., vastus lateralis transcripts) for which the pathway is significantly enriched. Clusters of enriched pathways were defined using Louvain community detection, and are annotated with high-level biological themes. C) Fatty acid oxidation pathway enrichment for the gastrocnemius (SKM-GN) proteome. Only significant genes are shown. Rows are clustered using hierarchical clustering. D) Log2 fold changes of significant differential protein phosphorylation sites in Complex I proteins in males and females. All phosphorylation changes are significant in females, whereas all except Ndufs5_T93 are significant in males after 8 weeks of training.
Figure 5.
Figure 5.. Endurance training alters the cardiac mitochondrial acetylome.
A) Graphical representation of the mitochondria-associated training-differential analytes in the cardiac muscle. Each node represents one of nine possible states (row labels, with F for females and M for males, seven states shown) at each of the four sampled training time points (column labels). Edges are drawn between nodes to represent the path of differential analytes over the training time course, with color representing the –ome. This graph includes the five largest paths for cardiac muscle. Both node and edge size are proportional to the number of analytes represented by the node or edge. B) Number of significantly up- and downregulated mitochondria-associated cardiac transcripts and proteins at each training timepoint, with color representation based on the main MitoCarta pathway association of each analyte. C-D) Network view of pathway enrichment results corresponding to the analytes C) downregulated in both sexes after 8 weeks (the 8w_F-1_M-1 node in (A)) and D) upregulated in both sexes after 8 weeks (the 8w_F1_M1 node in (A)). Nodes indicate significantly enriched pathways (10% FDR), and an edge represents a pair of nodes with a similarity score of at least 0.3 between the gene sets driving each pathway enrichment. Node fill color indicates for which –ome or –omes a pathway is significant, while a black border color indicates if the pathway is significant in both the down- and upregulated nodes. Node size is proportional to the number of differential analyte sets for which the pathway is significantly enriched. Clusters of enriched pathways were defined using Louvain community detection, and are annotated with high-level biological themes. E-F) Correlation between changes (log2 fold change) in protein levels and acetylation levels in males (E) and females (F). Orange color indicates MitoCarta proteins, while other proteins are shown in grey. G) Significant acetylation and phosphorylation changes (FDR<0.05) of mitochondrial metabolic proteins in male and female cardiac muscle after 8 weeks of endurance training (sites changing in only one sex are not illustrated). Each lollipop represents a specific acetylation (rounded top) or phosphorylation (diamond top) site, where red color indicates increases and blue decreases. Multiple lollipops on the same protein indicates several sites significantly changed with training. Hadha had 8 differentially acetylated sites in total, out of which only 6 are illustrated due to space constraints. Proteins displayed with a name different than the official gene name are Atp5b = Atp5f1b, Atp5c = Atp5f1c, Atp5a1 = Atp5f1a, Atp5j = Atp5pf, Atp5f1 = Atp5pb, Atp5o = Atp5po. H) Site-specific acetylation changes in ACAT1 in males (top panel) and females (bottom panel), and in I) ACO2 in males (left panel) and females (right panel). All displayed sites were differentially acetylated overall (taking all timepoints and sexes into account, FDR<0.05), and sites that reach timewise significance (FDR<0.05) are highlighted with black frames.
Figure 6.
Figure 6.. Training-induced mitochondrial adaptation in the liver through protein acetylation.
A) Graphical representation of the mitochondria-associated training-differential analytes in the liver. Each node represents one of nine possible states (row labels, with F for females and M for males, seven states shown) at each of the four sampled training time points (column labels). Edges are drawn between nodes to represent the path of differential analytes over the training time course, with edge representing the –ome. This graph includes the five largest paths for liver. Both node and edge size are proportional to the number of analytes represented by the node or edge. B-C) Correlation between changes (log2 fold change) in protein level and acetylation level in B) male and C) female liver. Pink color indicates MitoCarta proteins, while other proteins are shown in grey. D) Significant acetylation and phosphorylation changes (FDR<0.05) of mitochondrial metabolic proteins in male and female liver after 8 weeks of endurance training (sites changing in only one sex are not illustrated). Each lollipop represents a specific acetylation (rounded top) or phosphorylation (diamond top) site, where red color indicates increases and blue decreases. Multiple lollipops on the same protein indicates several sites significantly changed with training. Proteins with more significant differential sites than could be fitted into the illustration due to space were; Atp5c 9 sites, Atp5a1 9 sites, Atp5h 13 sites, and Idh2 15 sites in total. Proteins displayed with a name different than the official gene name are Atp5b = Atp5f1b, Atp5c = Atp5f1c, Atp5a1 = Atp5f1a, Atp5j = Atp5pf, Atp5h = Atp5pd, Atp5f1 = Atp5pb. E) Protein expression changes (log2 fold change) in Sirt3 and Sirt4. Females are represented by circles and males by triangles. * indicates significant change with training (FDR<0.05). F) Site-specific acetylation changes in HMGCS2 in males (left panel) and females (right panel). All displayed sites were differentially acetylated overall (taking all timepoints and sexes into account, FDR<0.05), and sites that reach timewise significance (FDR<0.05) are highlighted with black frames.
Figure 7.
Figure 7.. Training results in opposite regulation of mitochondrial proteins compared to type II diabetes and cirrhosis.
A) Significance of the overlap between the exercise-regulated differential proteins compared to identified proteins in case-control proteomics disease cohorts. The horizontal line represents p=0.05. MI = Myocardial Infarction, HCM = Hypertrophic Cardiomyopathy, NASH = Non-alcoholic Hepatosteatosis, Cirr = Cirrhosis, T2D = Type 2 Diabetes. B) Significance of the opposite directionality (Fisher’s exact test) when comparing the fold change sign of the overlapping proteins from (A). NAFLD = Non-alcoholic Fatty Liver Disease, HF = Heart Failure. C) Skeletal muscle T2D network. GeneMANIA network of the differential proteins that had sex-consistent response in week 8 of training and were both significant and had opposite direction of effect in two separate T2D cohorts. D) Liver cirrhosis network. GeneMANIA network of the 8-week female differential proteins that were both significant and had opposite direction of effect in the liver cirrhosis cohort.

Similar articles

  • The mitochondrial multi-omic response to exercise training across rat tissues.
    Amar D, Gay NR, Jimenez-Morales D, Jean Beltran PM, Ramaker ME, Raja AN, Zhao B, Sun Y, Marwaha S, Gaul DA, Hershman SG, Ferrasse A, Xia A, Lanza I, Fernández FM, Montgomery SB, Hevener AL, Ashley EA, Walsh MJ, Sparks LM, Burant CF, Rector RS, Thyfault J, Wheeler MT, Goodpaster BH, Coen PM, Schenk S, Bodine SC, Lindholm ME; MoTrPAC Study Group. Amar D, et al. Cell Metab. 2024 Jun 4;36(6):1411-1429.e10. doi: 10.1016/j.cmet.2023.12.021. Epub 2024 May 2. Cell Metab. 2024. PMID: 38701776
  • Sexual dimorphism and the multi-omic response to exercise training in rat subcutaneous white adipose tissue.
    Many GM, Sanford JA, Sagendorf TJ, Hou Z, Nigro P, Whytock K, Amar D, Caputo T, Gay NR, Gaul DA, Hirshman M, Jimenez-Morales D, Lindholm ME, Muehlbauer MJ, Vamvini M, Bergman B, Fern Ndez FM, Goodyear LJ, Ortlund EA, Sparks LM, Xia A, Adkins JN, Bodine SC, Newgard CB, Schenk S; MoTrPAC Study Group. Many GM, et al. bioRxiv [Preprint]. 2023 Feb 4:2023.02.03.527012. doi: 10.1101/2023.02.03.527012. bioRxiv. 2023. Update in: Nat Metab. 2024 May;6(5):963-979. doi: 10.1038/s42255-023-00959-9. PMID: 36778330 Free PMC article. Updated. Preprint.
  • Molecular Transducers of Physical Activity Consortium (MoTrPAC): human studies design and protocol.
    MoTrPAC Study Group; Jakicic JM, Kohrt WM, Houmard JA, Miller ME, Radom-Aizik S, Rasmussen BB, Ravussin E, Serra M, Stowe CL, Trappe S, Abouassi H, Adkins JN, Alekel DL, Ashley E, Bamman MM, Bergman BC, Bessesen DH, Broskey NT, Buford TW, Burant CF, Chen H, Christle JW, Clish CB, Coen PM, Collier D, Collins KA, Cooper DM, Cortes T, Cutter GR, Dubis G, Fernández FM, Firnhaber J, Forman DE, Gaul DA, Gay N, Gerszten RE, Goodpaster BH, Gritsenko MA, Haddad F, Huffman KM, Ilkayeva O, Jankowski CM, Jin C, Johannsen NM, Johnson J, Kelly L, Kershaw E, Kraus WE, Laughlin M, Lester B, Lindholm ME, Lowe A, Lu CJ, McGowan J, Melanson EL, Montgomery S, Moore SG, Moreau KL, Muehlbauer M, Musi N, Nair VD, Newgard CB, Newman AB, Nicklas B, Nindl BC, Ormond K, Piehowski PD, Qian WJ, Rankinen T, Rejeski WJ, Robbins J, Rogers RJ, Rooney JL, Rushing S, Sanford JA, Schauer IE, Schwartz RS, Sealfon SC, Slentz C, Sloan R, Smith KS, Snyder M, Spahn J, Sparks LM, Stefanovic-Racic M, Tanner CJ, Thalacker-Mercer A, Tracy R, Trappe TA, Volpi E, Walsh MJ, Wheeler MT, Willis L. MoTrPAC Study Group, et al. J Appl Physiol (1985). 2024 Sep 1;137(3):473-493. doi: 10.1152/japplphysiol.00102.2024. Epub 2024 Apr 18. J Appl Physiol (1985). 2024. PMID: 38634503
  • Exercise Effects on White Adipose Tissue: Beiging and Metabolic Adaptations.
    Stanford KI, Middelbeek RJ, Goodyear LJ. Stanford KI, et al. Diabetes. 2015 Jul;64(7):2361-8. doi: 10.2337/db15-0227. Epub 2015 Jun 7. Diabetes. 2015. PMID: 26050668 Free PMC article. Review.
  • Molecular Transducers of Physical Activity Consortium (MoTrPAC): Mapping the Dynamic Responses to Exercise.
    Sanford JA, Nogiec CD, Lindholm ME, Adkins JN, Amar D, Dasari S, Drugan JK, Fernández FM, Radom-Aizik S, Schenk S, Snyder MP, Tracy RP, Vanderboom P, Trappe S, Walsh MJ; Molecular Transducers of Physical Activity Consortium. Sanford JA, et al. Cell. 2020 Jun 25;181(7):1464-1474. doi: 10.1016/j.cell.2020.06.004. Cell. 2020. PMID: 32589957 Free PMC article. Review.

References

    1. Kluck R. M., Bossy-Wetzel E., Green D. R. & Newmeyer D. D. The release of cytochrome c from mitochondria: a primary site for Bcl-2 regulation of apoptosis. Science 275, 1132–1136 (1997). - PubMed
    1. Rensvold J. W. et al. Defining mitochondrial protein functions through deep multiomic profiling. Nature 606, 382–388 (2022). - PMC - PubMed
    1. Rath S. et al. MitoCarta3.0: an updated mitochondrial proteome now with sub-organelle localization and pathway annotations. Nucleic Acids Res. 49, D1541–D1547 (2021). - PMC - PubMed
    1. Mootha V. K. et al. Integrated analysis of protein composition, tissue diversity, and gene regulation in mouse mitochondria. Cell 115, 629–640 (2003). - PubMed
    1. Kappler L. et al. Linking bioenergetic function of mitochondria to tissue-specific molecular fingerprints. Am. J. Physiol. Endocrinol. Metab. 317, E374–E387 (2019). - PubMed

Publication types