[Preprint]. 2023 Jan 5:2023.01.04.522747.
doi: 10.1101/2023.01.04.522747.

DNA supercoiling-induced shapes alter minicircle hydrodynamic properties

Affiliations

DNA supercoiling-induced shapes alter minicircle hydrodynamic properties

Radost Waszkiewicz et al. bioRxiv. .

Update in

Abstract

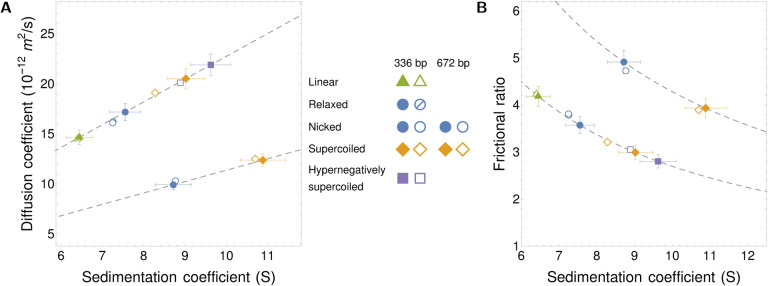
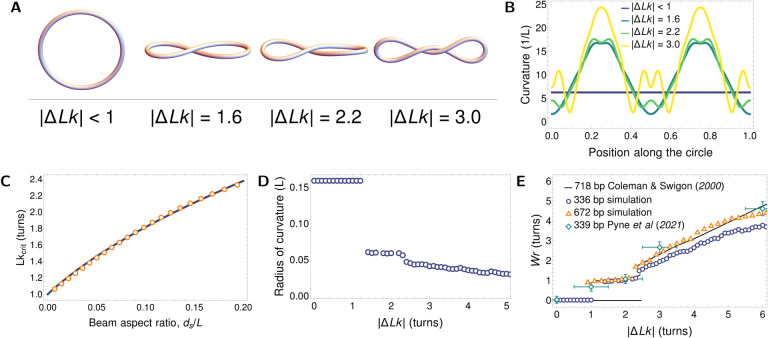
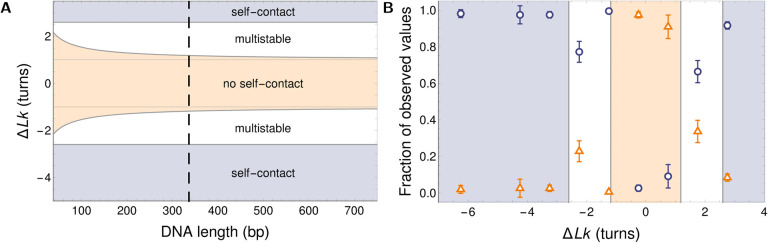
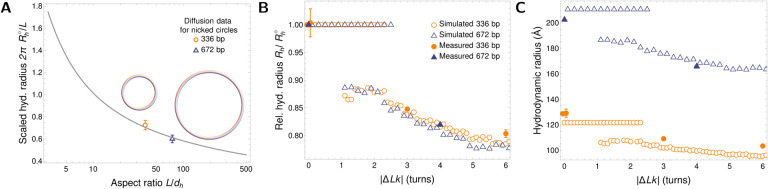
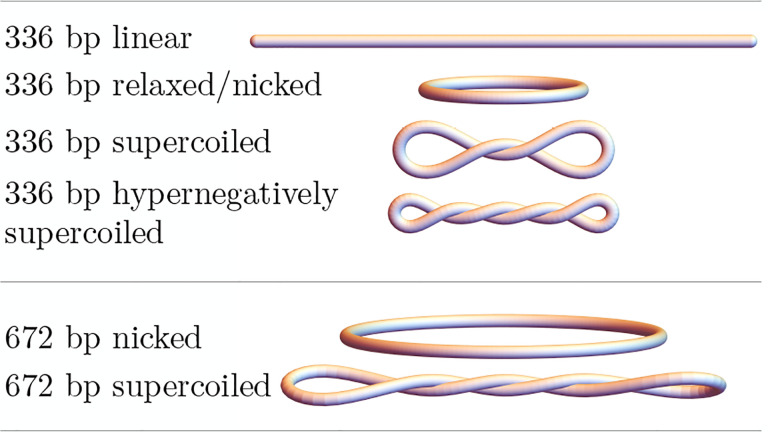
DNA in cells is organized in negatively supercoiled loops. The resulting torsional and bending strain allows DNA to adopt a surprisingly wide variety of 3-D shapes. This interplay between negative supercoiling, looping, and shape influences how DNA is stored, replicated, transcribed, repaired, and likely every other aspect of DNA activity. To understand the consequences of negative supercoiling and curvature on the hydrodynamic properties of DNA, we submitted 336 bp and 672 bp DNA minicircles to analytical ultracentrifugation (AUC). We found that the diffusion coefficient, sedimentation coefficient, and the DNA hydrodynamic radius strongly depended on circularity, loop length, and degree of negative supercoiling. Because AUC cannot ascertain shape beyond degree of non-globularity, we applied linear elasticity theory to predict DNA shapes, and combined these with hydrodynamic calculations to interpret the AUC data, with reasonable agreement between theory and experiment. These complementary approaches, together with earlier electron cryotomography data, provide a framework for understanding and predicting the effects of supercoiling on the shape and hydrodynamic properties of DNA.


Conflict of interest statement

Conflict of interest statement. Daniel J. Catanese, Jr., Jonathan M. Fogg, and Lynn Zechiedrich are co-inventors on issued and pending patents covering the supercoiled minicircle technology and uses and furthermore hold equity stake in Twister Biotech, Inc.

Figures

Figure 1.
Figure 1.
Electrophoretic mobility of minicircle DNA. (A) DNA samples were analyzed by polyacrylamide gel electrophoresis (5 % polyacrylamide) in 150 mM NaCl and 10 mM CaCl2 (the same conditions used in analytical ultracentrifugation). Mr: 100 bp DNA ladder, lanes 2–8: 336 bp minicircle topoisomer markers (Lk as indicated), lanes 9–13: 336 bp minicircle DNA samples (Sc: “supercoiled”, N: nicked, R: relaxed, H: “hypernegatively supercoiled,” L: linear), lanes 14–15: 672 bp DNA samples (Sc: “supercoiled,” N: nicked). (B) Determination of topoisomer identity in 672 bp samples. DNA samples were analyzed by electrophoresis on a 4 % polyacrylamide gel in the presence of 10 mM CaCl2. Mr: 100 bp DNA ladder, lanes 2–8: 672 bp minicircle topoisomer markers (Lk as indicated), lanes 9–10: 672 bp DNA samples (Sc: “supercoiled” as isolated from the bacteria, N: nicked).
Figure 2.
Figure 2.
Measured and predicted diffusion and sedimentation coefficients for DNA minicircles. AUC measurements using global Monte Carlo-Genetic Algorithm analysis are marked as empty symbols. Theoretical predictions are presented with filled symbols. (A) Diffusion coefficient as a function of the sedimentation coefficient for topoisomers of 336 bp (upper branch) and 672 bp (lower branch) minicircle DNA. Dashed lines represent the constant mean value of PSV determined from AUC experiments on which theoretical predictions of the sedimentation coefficient are based. Experimental and theoretical data for 336 bp and 672 bp relaxed and nicked minicircles overlay almost completely and thus are impossible to discern in the plots. (B) Frictional ratio as a function of the sedimentation coefficient. Sedimentation coefficients s are measured in svedberg units (S), with 1 S=10−13 s.
Figure 3.
Figure 3.
Elastic equilibrium shapes of model DNA minicircles. (A) Energy minimizing shapes of 336 bp minicircle of various ΔLk (with ds/L=0.018). For small |ΔLk| values (<1.6), loops adopt open circle configurations. For intermediate values (ΔLk=1.6 or 2.2), a single point of polymer contact is observed; for larger values of ΔLk (>2.2), continuous contact is observed. (B) Curvature distribution along the twisted loop centreline in shapes corresponding to panel (A). The position along the loop is measured from the point of contact (or the centre of symmetry in multiply touching configurations). (C) Lkcrit above which a writhed configuration can be stable, plotted as a function of the beam aspect ratio (steric diameter to length, ds/L). Solid line shows the approximation of eqn. (17). (D) Minimal radius of curvature along the loop as a function of ΔLk for the 336 bp minicircle. This radius decreases monotonically with ΔLk, leading to increasing bending stresses. (E) Writhe of energy-minimising shapes as a function of the aspect ratios ds/L=0.018, 0.0090, and 0.0082 for 336 bp, 672 bp, and 718 bp DNA minicircles respectively. For small values of |ΔLk|, only flat (open circle) configurations are permitted but above Lkcrit, one or more twists is relaxed by writhing. For large values of ΔLk, around 90 % of torsional energy is relaxed by shape deformation. Our results are shown next to the continuum model predictions of Coleman & Swigon (38) and atomistic MD simulations of Pyne et al. (15).
Figure 4.
Figure 4.
Regimes of shape stability for model DNA minicircles. (A) Phase diagram of different regimes of stability of twisted DNA as a function of ΔLk and DNA length. The phase space is divided into three regions: only open circular configurations permissible (tan-shaded area), both circular and writhed configurations permissible (multistability; white area), and only writhed configurations permissible (blue-shaded area). The dashed line marks the 336 bp minicircles, for which experimental shape data are available. (B) Plot of the relative occurrence rate of configurations with (blue circles) and without (orange triangles) points of self contact, based on cryoET shapes of 336 bp minicircles measured by Irobalieva et al. (13) and overlayed on our theoretical stability predictions with the same colour coding as in panel (A). Error bars represent 2 standard deviations.
Figure 5.
Figure 5.
Hydrodynamic radius of DNA minicircles. (A) Hydrodynamic radius Rh0 of open-circular DNA, scaled by the geometric radius L/2π of a torus, plotted for a range of DNA aspect ratios L/dh. Comparing the ZENO results for toroidal particles (solid line) to diffusion measurements of minicircles with 336 bp and 672 bp yields the fitted (common) hydrodynamic thickness dh=29.4 Å. We note that ZENO approximation yields high-precision results for toroidal particles (45). This value was used in all subsequent computations. Circular sketches representing molecules preserve both the relative scale and thickness. Note the logarithmic scale on the horizontal axis. (B) Hydrodynamic radius Rh of minicircle shapes, relative to the hydrodynamic radius Rh0 of the relaxed, open-circular shape for a range of |ΔLk|. We present results of simulations (open circles and triangles) along with experimental data for 336 bp (filled diamonds) and 672 bp (filled squares) minicircles. For 336 bp (nicked); 336 bp (relaxed), and 672 bp (nicked), the simulations show a region of constant hydrodynamic radius where the shape is independent of |ΔLk|. For supercoiled 336 bp containing a mixture of ΔLk=−1, −2 or −3, the hydrodynamic radius is about 15 % smaller than that of an open circle. For larger values of |ΔLk|, the theoretical approach seems to correctly grasp hydrodynamic radii of the resulting highly compact conformers. (C) Absolute values of the hydrodynamic radius Rh for minicircles from (B), with the same point markers.
Figure 6.
Figure 6.
Sketches of model shapes in a given minicircle configuration used for hydrodynamic simulations with ΔLk specified in the caption of Table 2. The sketches have realistic aspect ratios (dh/L) and preserve the relative size.

Similar articles

References

    1. Franklin R. E. and Gosling R. G. (4, 1953) Molecular configuration in sodium thymonucleate. Nature, 171(4356), 740–741. - PubMed
    1. Lieberman-Aiden E., van Berkum N. L., Williams L., Imakaev M., Ragoczy T., Telling A., Amit I., Lajoie B. R., Sabo P. J., Dorschner M. O., Sandstrom R., Bernstein B., Bender M. A., Groudine M., Gnirke A., Stamatoyannopoulos J., Mirny L. A., Lander E. S., and Dekker J. (10, 2009) Comprehensive mapping of long-range interactions reveals folding principles of the human genome. Science (New York, N.Y.), 326(5950), 289–293 - PMC - PubMed
    1. Dorman C. J. (2013) Genome architecture and global generegulation in bacteria: making progress towards a unified model?. Nature Reviews. Microbiology, 11(5), 349–355 - PubMed
    1. Fisher J. K., Bourniquel A., Witz G., Weiner B., Prentiss M., and Kleckner N. (5, 2013) Four-dimensional imaging of E. coli nucleoid organization and dynamics in living cells. Cell, 153(4), 882–895 - PMC - PubMed
    1. Kleckner N., Fisher J. K., Stouf M., White M. A., Bates D., and Witz G. (12, 2014) The bacterial nucleoid: nature, dynamics and sister segregation. Current Opinion in Microbiology, 22, 127–137 - PMC - PubMed

Publication types