. 2023 Feb 16;83(4):523-538.e7.
doi: 10.1016/j.molcel.2023.01.004. Epub 2023 Jan 25.

Centromeres as universal hotspots of DNA breakage, driving RAD51-mediated recombination during quiescence

Affiliations

Centromeres as universal hotspots of DNA breakage, driving RAD51-mediated recombination during quiescence

Xanita Saayman et al. Mol Cell. .

Abstract

Centromeres are essential for chromosome segregation in most animals and plants yet are among the most rapidly evolving genome elements. The mechanisms underlying this paradoxical phenomenon remain enigmatic. Here, we report that human centromeres innately harbor a striking enrichment of DNA breaks within functionally active centromere regions. Establishing a single-cell imaging strategy that enables comparative assessment of DNA breaks at repetitive regions, we show that centromeric DNA breaks are induced not only during active cellular proliferation but also de novo during quiescence. Markedly, centromere DNA breaks in quiescent cells are resolved enzymatically by the evolutionarily conserved RAD51 recombinase, which in turn safeguards the specification of functional centromeres. This study highlights the innate fragility of centromeres, which may have been co-opted over time to reinforce centromere specification while driving rapid evolution. The findings also provide insights into how fragile centromeres are likely to contribute to human disease.

Keywords: CENP-A; DNA damage; RAD51; centromeres; homologous recombination.


Conflict of interest statement

Declaration of interests The authors declare no competing interests.

Figures
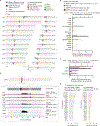
Figure 1 |
Figure 1 |. DNA strand breaks are enriched at human centromeres
(A) Alignment of publicly available next generation sequencing data detecting DNA strand breaks (GLOE-seq) above and CENP-A localization (ChIP-seq) below across 22 autosome chromosomes and chromosome X of the human T2T-CHM13 reference assembly. Centromeric regions are composed of alpha satellites within higher order repeats (αSat HORs), alpha satellites within diverged HORs (αSat diverged HORs), monomeric / diverged alpha satellites (αSat mono/div.), human satellites (HSat), beta satellites (beta sat), gamma satellites (gamma sat), transition regions, other satellites (censat) and ribosomal DNA arrays (rDNA). p and q chromosome arms indicated below. (B) Fold enrichment of DNA breaks, HCT116 input and CENP-A (both CUT&RUN and ChIP-seq) reads across all annotated repeat types of the T2T-CHM13 reference genome. (C) Fold enrichment of DNA breaks, HCT116 input and CENP-A CUT&RUN reads over alpha satellites annotated as being either part of HORs, divergent HORs (dHOR) or monomeric. (D) Inset of chr10 centromere depicting total DNA breaks (GLOE-seq) and DNA DSBs (END-seq) with the corresponding input cell line (HCT116), as well as CENP-A localization (CUT&RUN above, ChIP-seq below) with the corresponding negative control (IgG above, ChIP-seq input below). (E) Enrichment scores of GLOE-seq or END-seq in HCT116 cells across human centromere HORs. Enrichment scores were calculated as the sums of mapped reads within centromeric HORs of each chromosome relative to that of the corresponding input control, after normalizing to read depth. Acrocentric chromosomes containing rDNA arrays are marked as indicated. See also Figures S1 and S2.
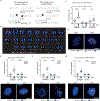
Figure 2 |
Figure 2 |. Detection of spontaneous centromere HOR breaks with exo-FISH
(A) Schematic of the detection of DNA breaks at repetitive elements using exo-FISH. (B) Karyogram depicting FISH probe hybridization patterns. FISH probes against HOR-associated centromere repeats (cenFISH, white), telomere repeats (telFISH, green) and human satellites 2 and 3 (HSatFISH, red) are depicted. (C, D) Quantification and representative images of exo-FISH applied to asynchronous hTERT-RPE1 cells with and without Exonuclease III (EXO) treatment. FISH signal intensity was calculated by first taking the sum of the fluorescence signal surrounding each cenFISH, telFISH or HSatFISH focus in a 14×14–20×20 pixel box, following a perimeter-estimated background subtraction. The median value for each cell is then calculated and plotted above, with each data point representing a cell median. (E) Representative images and quantification of exo-FISH in interphase hTERT-RPE1 cells. (F) Representative images and quantification of exo-FISH in mitotic hTERT-RPE1 cells. Cells were arrested in mitosis with a 3–5-hour STLC treatment and harvested by mitotic shake-off prior to spreading. (G) Representative images and quantification of exo-FISH in quiescent (i.e., serum-starved hTERT-RPE1) cells. Cells were serum-starved for ~120 hours before harvesting. Scale bar represents 10 μm. FISH signal intensity is X10,000 arbitrary units (A.U.). At least 30 cells were imaged per experimental condition. The medians of each experimental condition were used to perform a two-sided unpaired t-test (*p<0.05, **p<0.01). Filled and empty circles indicate presence and absence, respectively. See also Figure S3.
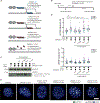
Figure 3 |
Figure 3 |. DNA replication -dependent and -independent sources of centromere HOR DNA breaks
(A) Experimental schematic of time course following induction of quiescence through serum starvation in hTERT-RPE1 cells. (B, C) Quantification and representative images of exo-FISH performed at the indicated time points. Quantification was performed as in Figure 2. Scale bar represents 10 μm. FISH signal intensity is X10,000 arbitrary units (A.U.). At least 30 cells were imaged per experimental condition. The medians of each experimental condition were used to perform a two-sided unpaired t-test (*p<0.05, **p<0.01). Filled and empty circles indicate presence and absence, respectively. See also Figure S4.
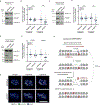
Figure 4 |
Figure 4 |. Topoisomerase IIβ induces centromere DNA breaks in quiescent cells
(A) Experimental schematic for the depletion of the five human nuclear topoisomerases in serum-starved hTERT-RPE1 cells. hTERT-RPE1 cells were serum-starved for 24 hours prior to RNAi treatment and harvested after another 72 hours. (B) Western blot verifying the depletion of topoisomerase I (TOPI), topoisomerase IIα (TOP2A), topoisomerase IIβ (TOP2B), topoisomerase IIIα (TOP3A) and topoisomerase IIIβ (TOP3B) 72 hours after RNAi treatment with 50 nM siRNA. Lamin-A levels were used as a loading control. (C, D) Quantification and representative images of exo-FISH following 72 hours depletion of human topoisomerases. Quantification was performed as in Figure 2. The difference in exo-FISH signals between +ExoIII and −ExoIII was then calculated and plotted. Scale bar represents 10 μm. FISH signal intensity is X10,000 arbitrary units (A.U.). At least 30 cells were imaged per experimental condition. The medians of each experimental condition were used to perform a two-sided unpaired t-test (*p<0.05, **p<0.01). See also Figure S5.
Figure 5 |
Figure 5 |. The recombinase RAD51 prevents the accumulation of centromere HOR DNA DSBs during quiescence
(A) Experimental schematic for the detection of centromeric breaks upon RAD51 depletion in quiescent hTERT-RPE1 cells. (B) Western blot confirming the depletion of RAD51 protein levels 72 hours after siRNA treatment. Lamin-A levels were used as a loading control. (C, D) Representative images and quantification of exo-FISH following RAD51 depletion. Quantification of FISH signals were performed as in Figure 2. Scale bar represents 10 μm. FISH signal intensity is X10,000 arbitrary units (A.U.). At least 30 cells were imaged per experimental condition. The averages of each experimental condition were used to perform a two-sided unpaired t-test (*p<0.05, **p<0.01). Filled and empty circles indicate presence and absence, respectively. (E) Inset of chr10 centromere depicting DNA DSBs (END-seq) following 96 hours depletion of RAD51 or the negative control in serum-starved hTERT-RPE1 cells. NGS alignment was performed with both PCR duplicate removal and spike-in normalisation. Baseline deviation of reads on the right arm of chr10 likely indicate some copy-number variation of hTERT-RPE1 relative to the T2T-CHM13 reference genome. (F) Enrichment END-seq scores across hTERT-RPE1 centromere HORs. NGS alignment was performed with both PCR duplicate removal and spike-in normalisation, and enrichment scores were quantified as in Figure 1. See also Figure S6.
Figure 6 |
Figure 6 |. RAD51 strand-exchange activity is required for the protection of centromere HORs in quiescent cells
(A) Schematic of RAD51 separation-of-function variant functionalities. (B) Experimental schematic for the detection of centromeric breaks upon endogenous RAD51 depletion and expression of FLAG fusion of RAD51 variants in quiescent hTERT-RPE1 cells. (C) Western blot confirming the depletion of endogenous RAD51 (end. RAD51) 48 hours after siRNA treatment, and expression of separation-of-function variants upon doxycycline (DOX) treatment. Lamin-A levels were used as a loading control. (D, E) Quantification and representative images of exo-FISH following depletion of endogenous RAD51 and re-expression of the RAD51 separation-of-function variants, 96 hours after siRNA treatment in serum-starved hTERT-RPE1 cells. Quantification of FISH signals were performed as in Figure 2. Scale bar represents 10 μm. FISH signal intensity is X10,000 arbitrary units (A.U.). At least 30 cells were imaged per experimental condition. The averages of each experimental condition were used to perform a two-sided unpaired t-test (*p<0.05, **p<0.01). Filled and empty circles indicate presence and absence, respectively. See also Figure S7.
Figure 7 |
Figure 7 |. Loss of centromere identity in the absence of RAD51
(A) Western blot confirming the depletion of RAD51 in asynchronous HCT116 cells, 72 hours after siRNA transfection. For all Western blots, Lamin-A levels were used as a loading control. (B) Quantification of CENP-A and CENP-B levels in asynchronous HCT116 cells, 96 hours after siRNA-mediated depletion of RAD51. CENP-B foci were used to define centromere loci, and quantification was performed as in Figure S5. (C) Western blot confirming the depletion of RAD51 in asynchronous hTERT-RPE1 cells, 96 hours after siRNA transfection. Dashed line indicates where the blot was cropped. (D) As in (B) but for asynchronous hTERT-RPE1 cells. (E) Western blot confirming the depletion of RAD51 in serum-starved hTERT-RPE1 cells. Cells were serum-starved for 24 hours prior to siRNA treatment and harvested 72 hours later. (F) As in (B) but for serum-starved hTERT-RPE1 cells. (G) Representative images of (F). At least 30 cells were imaged per experimental condition, and the medians of each experimental condition were used to perform a two-sided unpaired t-test (*p<0.05, **p<0.01). (H) Model for the role of RAD51-mediated recombination at spontaneous centromere HOR DNA breaks. See also Figure S8.

Similar articles

Cited by

  • Genome maintenance meets mechanobiology.
    Spegg V, Altmeyer M. Spegg V, et al. Chromosoma. 2024 Jan;133(1):15-36. doi: 10.1007/s00412-023-00807-5. Epub 2023 Aug 15. Chromosoma. 2024. PMID: 37581649 Free PMC article. Review.
  • The complete diploid reference genome of RPE-1 identifies human phased epigenetic landscapes.
    Volpe E, Corda L, Tommaso ED, Pelliccia F, Ottalevi R, Licastro D, Guarracino A, Capulli M, Formenti G, Tassone E, Giunta S. Volpe E, et al. bioRxiv [Preprint]. 2023 Dec 30:2023.11.01.565049. doi: 10.1101/2023.11.01.565049. bioRxiv. 2023. PMID: 38168337 Free PMC article. Preprint.
  • Noncanonical Roles of RAD51.
    Thomas M, Dubacq C, Rabut E, Lopez BS, Guirouilh-Barbat J. Thomas M, et al. Cells. 2023 Apr 15;12(8):1169. doi: 10.3390/cells12081169. Cells. 2023. PMID: 37190078 Free PMC article. Review.
  • Most large structural variants in cancer genomes can be detected without long reads.
    Choo ZN, Behr JM, Deshpande A, Hadi K, Yao X, Tian H, Takai K, Zakusilo G, Rosiene J, Da Cruz Paula A, Weigelt B, Setton J, Riaz N, Powell SN, Busam K, Shoushtari AN, Ariyan C, Reis-Filho J, de Lange T, Imieliński M. Choo ZN, et al. Nat Genet. 2023 Dec;55(12):2139-2148. doi: 10.1038/s41588-023-01540-6. Epub 2023 Nov 9. Nat Genet. 2023. PMID: 37945902 Free PMC article.
  • DNA Damage Atlas: an atlas of DNA damage and repair.
    Liang Y, Yuan Q, Zheng Q, Mei Z, Song Y, Yan H, Yang J, Wu S, Yuan J, Wu W. Liang Y, et al. Nucleic Acids Res. 2024 Jan 5;52(D1):D1218-D1226. doi: 10.1093/nar/gkad845. Nucleic Acids Res. 2024. PMID: 37831087 Free PMC article.

References

    1. Wu JC, and Manuelidis L (1980). Sequence definition and organization of a human repeated DNA. J Mol Biol 142, 363–386. 10.1016/0022-2836(80)90277-6. - DOI - PubMed
    1. Willard HF (1985). Chromosome-specific organization of human alpha satellite DNA. Am J Hum Genet 37, 524–532. - PMC - PubMed
    1. Willard HF, and Waye JS (1987). Chromosome-specific subsets of human alpha satellite DNA: analysis of sequence divergence within and between chromosomal subsets and evidence for an ancestral pentameric repeat. J Mol Evol. 25, 207–214. - PubMed
    1. Melters DP, Bradnam KR, Young HA, Telis N, May MR, Ruby JG, Sebra R, Peluso P, Eid J, Rank D, et al. (2013). Comparative analysis of tandem repeats from hundreds of species reveals unique insights into centromere evolution. Genome Biology 14, R10. - PMC - PubMed
    1. Marshall OJ, Chueh AC, Wong LH, and Choo KH (2008). Neocentromeres: new insights into centromere structure, disease development, and karyotype evolution. Am J Hum Genet 82, 261–282. 10.1016/j.ajhg.2007.11.009. - DOI - PMC - PubMed

Publication types