. 2023 Jan 31;120(5):e2216851120.
doi: 10.1073/pnas.2216851120. Epub 2023 Jan 26.

Cytosolic and mitochondrial ribosomal proteins mediate the locust phase transition via divergence of translational profiles

Affiliations

Cytosolic and mitochondrial ribosomal proteins mediate the locust phase transition via divergence of translational profiles

Jing Li et al. Proc Natl Acad Sci U S A. .

Abstract

The phase transition from solitary to gregarious locusts is crucial in outbreaks of locust plague, which threaten agricultural yield and food security. Research on the regulatory mechanisms of phase transition in locusts has focused primarily on the transcriptional or posttranslational level. However, the translational regulation of phase transition is unexplored. Here, we show a phase-dependent pattern at the translation level, which exhibits different polysome profiles between gregarious and solitary locusts. The gregarious locusts exhibit significant increases in 60S and polyribosomes, while solitary locusts possess higher peaks of the monoribosome and a specific "halfmer." The polysome profiles, a molecular phenotype, respond to changes in population density. In gregarious locusts, ten genes involved in the cytosolic ribosome pathway exhibited increased translational efficiency (TE). In solitary locusts, five genes from the mitochondrial ribosome pathway displayed increased TE. The high expression of large ribosomal protein 7 at the translational level promotes accumulation of the free 60S ribosomal subunit in gregarious locusts, while solitary locusts employ mitochondrial small ribosomal protein 18c to induce the assembly of mitochondrial ribosomes, causing divergence of the translational profiles and behavioral transition. This study reveals the translational regulatory mechanism of locust phase transition, in which the locusts employ divergent ribosome pathways to cope with changes in population density.

Keywords: behavioral aggregation; cytosolic and mitochondrial ribosomal proteins; migratory locust; phase transition; translational regulation.


Conflict of interest statement

The authors declare no competing interest.

Figures

Fig. 1.
Fig. 1.
Polysome profile differences between gregarious and solitary locusts. (A) Absorbance (A254 nm) of sucrose density gradient-fractionated ribosomes from RNase I- or mock-treated (control) gregarious locusts. (B) Absorbance (A254 nm) of sucrose density gradient fractionated ribosomes from RNase I- or mock-treated (control) solitary locusts. (C) Mass spectrometry (MS/MS) analysis of proteins in fractions 5, 7, and 9 of the sucrose density gradient. (D) Absorbance (A254 nm) of sucrose density gradient fractions measured from ribosomes in gregarious locusts. (E) Absorbance (A254 nm) of sucrose density gradient fractions measured from ribosomes in solitary locusts. (F) Different polysome profiles from gregarious and solitary locusts. The X-axis indicates thetop (fraction 1) to the bottom (fraction 15)  from 0 mm to 75 mm of the 5 to 50% sucrose gradient. The Y-axis indicates the absorbance (A254 nm) from ribosomes. The red arrowheads indicate specific peaks in solitary locusts. Yellow regions highlight 60S ribosomal subunits and polyribosomes. (G) Quantification of polysome peak sizes of gregarious and solitary locusts in representative experiments with n = 3, normalized to the P1 peak of solitary locusts. The normalized method was performed as in a previous study (30). Bars represent the mean ± SEM, and significance was tested with Student’s t test, with *P < 0.05, **< 0.01, ***< 0.001, ****< 0.0001. (H) The number of differential abundance proteins from 60S fractions in gregarious and solitary locusts was detected by mass spectrometry (MS/MS). The 60S fractions contain the 60S large ribosomal subunit and 60S mitochondrial ribosomes in locusts. The higher abundance of proteins (MS/MS count fold change > 1.2) in gregarious locusts than solitary locusts was defined as Up in G, while the higher abundance of proteins (MS/MS count fold change > 1.2) in solitary locusts than gregarious locusts was defined as Up in S.
Fig. 2.
Fig. 2.
Dynamic changes in the locust polysome profile in response to population density. (A–F) Absorbance (A254 nm) of sucrose density gradient fractions measured from ribosomes in locusts at six different population densities, namely, 2, 5, 10, 25, 50, and 100 nymphs. The X-axis indicates the top (fraction 1) to the bottom (fraction 15)  from 0 mm to 75 mm of the 5 to 50% sucrose gradient. The Y-axis indicates the absorbance (A254 nm) of ribosomes. The red arrowheads indicate peaks specific to solitary locusts. Yellow regions highlight 60S ribosomal subunits. (G) Quantification of polysome peak sizes of locusts at six different population densities in representative experiments with n = 3, normalized to the P1 peak of 2 nymphs. The normalized method was performed as previously described (30). P values were calculated using a t test, with *< 0.05, **< 0.01, ***< 0.001, ****< 0.0001.
Fig. 3.
Fig. 3.
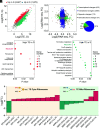
Changes in TE of divergent genes between the two phases of the migratory locusts. (A) Comparison of TE in gregarious and solitary locusts. Red dots represent significantly up-regulated genes in gregarious locusts (FDR < 0.01). Blue dots represent significantly up-regulated genes in solitary locusts (FDR < 0.01). Gray dots represent genes with no significant change in TE. The total gene number used for analysis is shown in parentheses. (B) Changes in mRNA abundance and TE in gregarious locusts compared with solitary locusts. Log2 of the mRNA fold change is shown on the horizontal axis, and log2 of the TE fold change is shown on the vertical axis. Differentially expressed genes at the transcriptional and translational levels are shown in parentheses (Left). The proportions of different changes from transcription and translation contribute to TE alteration in pie chart (Right). (C) Pathway analysis of genes with increased TE in gregarious locusts. (D) Pathway analysis of genes with increased TE in solitary locusts. (E) Differentially expressed genes from the ribosome pathway with increased TE in gregarious and solitary locusts. The corresponding names in the new nomenclature were provided at the first mention of the RP genes.
Fig. 4.
Fig. 4.
Changes in TE of ribosomal protein genes between gregarious and solitary locusts. (A and B) The relative mRNA levels of two up-regulated ribosomal protein genes in gregarious locusts were measured by qPCR performed from the top (fraction 1) to the bottom (fraction 15) of the polysome gradient. (C–G) The relative mRNA levels of five up-regulated ribosomal protein genes in solitary locusts were measured by qPCR from the top (fraction 1) to the bottom (fraction 15) of the polysome gradient. Expression values were normalized based on the addition of equal amounts of luciferase RNA to each fraction prior to RNA extraction. Standard error of mean were calculated from three biological repeats. P values were calculated using a t test, with *< 0.05, **< 0.01, ***< 0.001, ****< 0.0001.
Fig. 5.
Fig. 5.
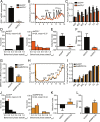
Contributions of RPL7 and MRPS18c genes to the changes in polysome profiles and behavioral shift in locust phase transition. (A–F) Effects on RNAi, polysome profile, behavioral phase change (Pgreg), attraction index, and total distance of movement (TDM) caused by injecting dsRNA of RPL7 into gregarious locusts. (G–L) Effects on RNAi, polysome profile, behavioral phase change (Pgreg), attraction index, and total distance of movement (TDM) caused by injecting dsRNA of MRPS18c into solitary locusts. Quantification of polysome peak sizes of gregarious and solitary locusts in representative experiments with n = 3, normalized to the P1 peak of dsGFP locusts. Dark columns represent the control group (dsGFP). Orange columns represent the treated group. Red arrows show the mean values of Pgreg. “N” indicates the number of locusts in each group. Bars represent the mean ± SEM, and significance was tested with Student’s t test. P values were calculated using a t test, with *< 0.05, **< 0.01, ***< 0.001.
Fig. 6.
Fig. 6.
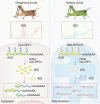
Translational regulation effect of RPs from cytoplasm and mitochondria on the divergence of ribosome profiles in gregarious and solitary locusts. In gregarious locusts, the high expression of cyto-RPL7 the translational level or other cyto-RPLs promotes accumulation of the free 60S ribosomal subunit in cytoplasm (Left). By contrast, solitary locusts employ MRPS18c or other mito-RPs to induce the assembly of mitochondrial ribosomes, causing divergence of the translational profiles and behavioral transition (Right).

Similar articles

Cited by

References

    1. Wang X. H., Kang L., Molecular mechanisms of phase change in locusts. Annu. Rev. Entomol. 59, 225–244 (2014). - PubMed
    1. Pener M. P., Simpson S. J., “Locust phase polyphenism: An update” in Advances in Insect Physiology, Simpson S. J., Pener M. P., Eds. (Academic Press, 2009), Vol. 36, pp. 1–272.
    1. Ayali A., The puzzle of locust density-dependent phase polyphenism. Curr. Opin. Insect Sci. 35, 41–47 (2019). - PubMed
    1. Yang M. L., et al. , A β-carotene-binding protein carrying a red pigment regulates body-color transition between green and black in locusts. eLife 8, e41362 (2019). - PMC - PubMed
    1. Du B. Z., Ding D., Ma C., Guo W., Kang L., Locust density shapes energy metabolism and oxidative stress resulting in divergence of flight traits. Proc. Natl. Acad. Sci. U.S.A. 119, e2115753118 (2022). - PMC - PubMed

Publication types

Substances

LinkOut - more resources