

Scientific opinion on the tolerable upper intake level for selenium
- PMID: 36698500
- PMCID: PMC9854220
- DOI: 10.2903/j.efsa.2023.7704
Scientific opinion on the tolerable upper intake level for selenium
Abstract
Following a request from the European Commission, the EFSA Panel on Nutrition, Novel Foods and Food Allergens (NDA) was asked to deliver a scientific opinion on the tolerable upper intake level (UL) for selenium. Systematic reviews of the literature were conducted to identify evidence regarding excess selenium intake and clinical effects and potential biomarkers of effect, risk of chronic diseases and impaired neuropsychological development in humans. Alopecia, as an early observable feature and a well-established adverse effect of excess selenium exposure, is selected as the critical endpoint on which to base a UL for selenium. A lowest-observed-adverse-effect-level (LOAEL) of 330 μg/day is identified from a large randomised controlled trial in humans (the Selenium and Vitamin E Cancer Prevention Trial (SELECT)), to which an uncertainty factor of 1.3 is applied. A UL of 255 μg/day is established for adult men and women (including pregnant and lactating women). ULs for children are derived from the UL for adults using allometric scaling (body weight0.75). Based on available intake data, adult consumers are unlikely to exceed the UL, except for regular users of food supplements containing high daily doses of selenium or regular consumers of Brazil nuts. No risk has been reported with the current levels of selenium intake in European countries from food (excluding food supplements) in toddlers and children, and selenium intake arising from the natural content of foods does not raise reasons for concern. Selenium-containing supplements in toddlers and children should be used with caution, based on individual needs.
Keywords: UL; dietary reference value; selenium; tolerable upper intake level.
© 2023 Wiley‐VCH Verlag GmbH & Co. KgaA on behalf of the European Food Safety Authority.
Figures
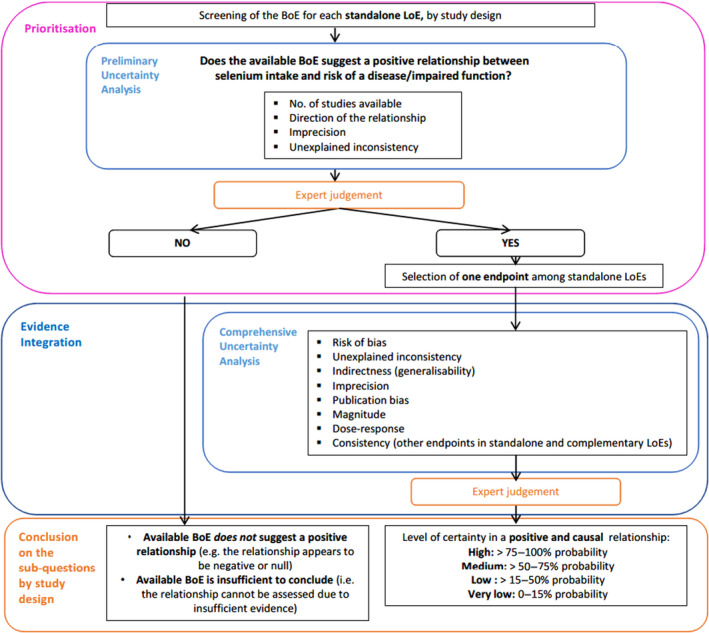
BoE: body of evidence; LoE: line of evidence.
Adapted from OHAT‐NTP (2019).
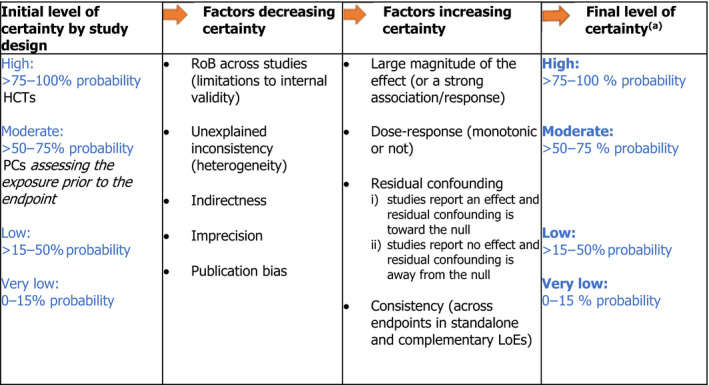
LoE: line of evidence; PC: prospective cohort study; HCT: human controlled trial; RoB: risk of bias.
(a): As an example, a ‘high level of certainty’ means that, based on the available evidence, experts are 75%–100% certain that selenium is positively and causally associated with the disease of interest.
Based on Burk and Hill (2015), Combs (2015), Saito (2021), Jäger et al. (2016a,b), Thiry et al. (2012), and Rayman et al. (2008a).
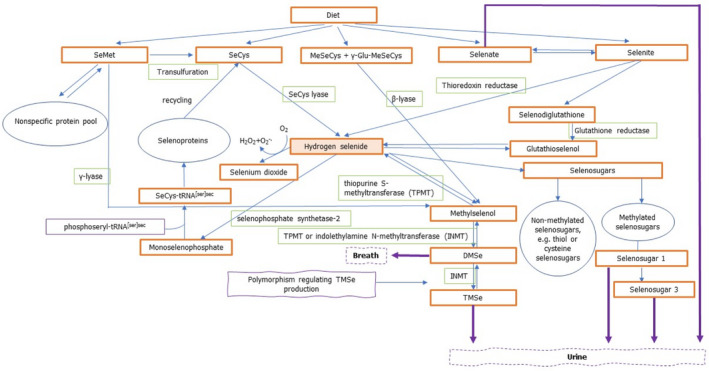
DMSe: dimethylselenide; γ‐Glu‐MeSeCys: γ‐glutamyl‐Se‐methyl‐selenocysteine; INMT: indolethylamine N‐methyltransferase; MeSeCys: Se‐methyl‐selenocysteine; SeMet: selenomethionine; SeCys: selenocysteine; TMSe: trimethylselenonium ion; tRNA: transfer ribonucleic acid; TPMT: thiopurine S‐methlytransferase.
Se: selenium.
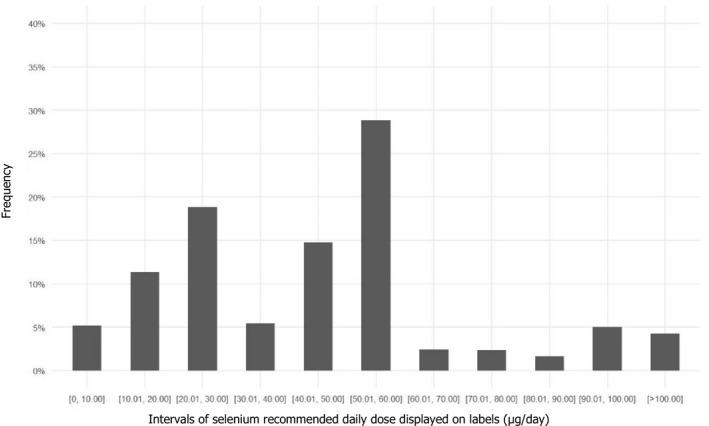
Source: Mintel GNPD database. Search for selenium‐containing supplements available in the EU market in the last 5 years (from January 2016 to December 2021). A total of 1,238 products available in 24 EU Member States and Norway were identified.
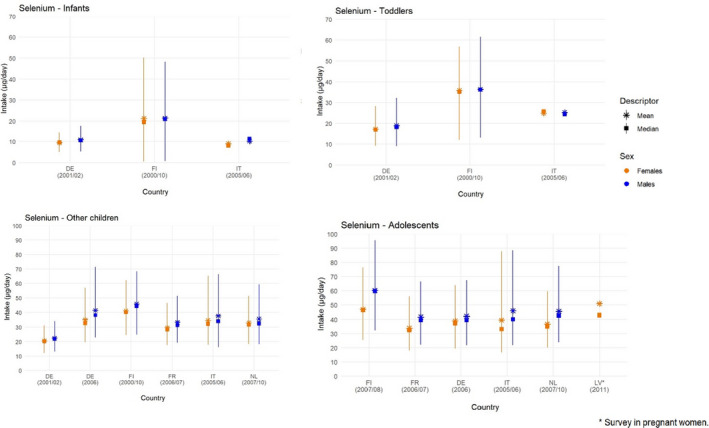
Lines represent the range between the 5th and 95th percentiles. Estimated intakes from 5th and 95th percentiles are not presented when sample size is below 60 participants.
DE: Germany; FI: Finland; FR: France; IT: Italy; LV: Latvia; NL: Netherlands.
Source: (EFSA NDA Panel, 2014), except for infants.
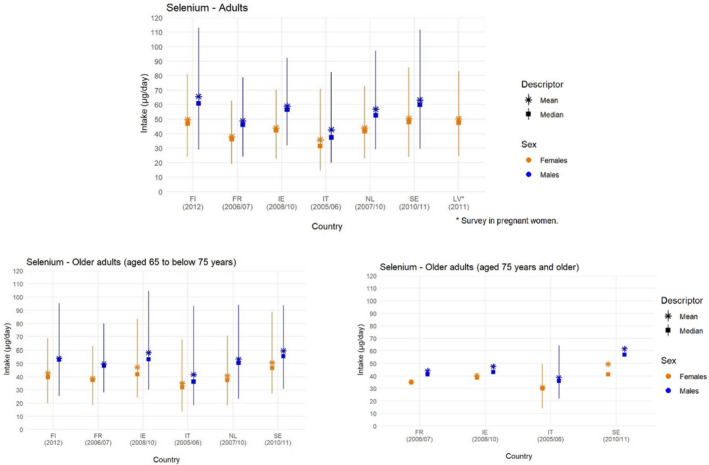
Lines represent the range between the 5th and 95th percentiles. Estimated intakes from 5th and 95th percentiles are not presented when sample size is below 60 participants.
FI: Finland; FR: France; IE: Ireland; IT: Italy; LV: Latvia; NL: Netherlands; SE: Sweden.
Source: (EFSA NDA Panel, 2014).

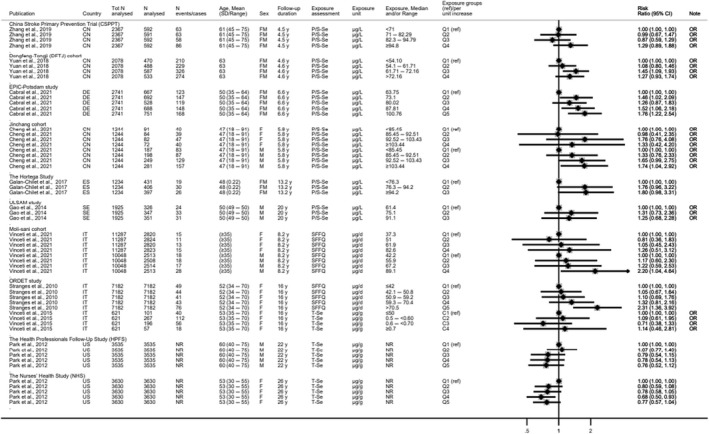
*Denotes hypertension definition different from other studies.
BD: Bangladesh; BE: Belgium; BEST Bangladesh Vitamin E and Selenium Trial; B‐Se: blood selenium; CI: confidence interval; CN: China; FLEMENGHO: Flemish Study on Environment Genes and Health Outcomes; FM: females and males; N‐Se: nail selenium; NR: not reported; P/S‐Se: plasma/serum selenium, Q: quantile; SD: standard deviation; y: years.
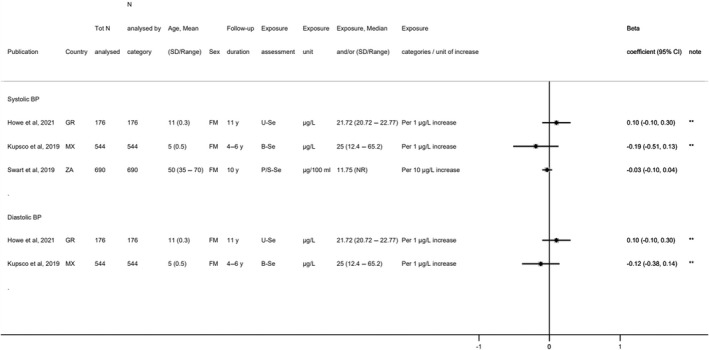
*Denotes estimated annual changes in blood pressure; **denotes mother–child pair studies where exposure was analysed in the mothers and outcome in their child; the age of children is shown.
BD: Bangladesh; BP: blood pressure; B‐Se: blood selenium; CI: confidence interval; FM: females and males; GR: Greece; MX: Mexico; SD: standard deviation; U‐Se: urinary selenium; ZA: South Africa; y: years.
*Denotes depletion study.
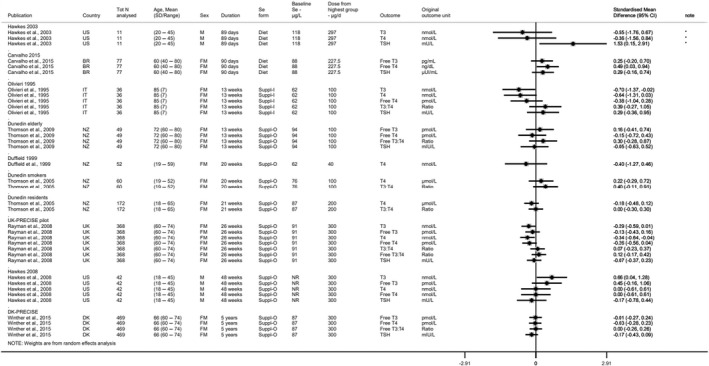
BR: Brazil; CI: confidence interval; DK: Denmark; FM: females and males; IT: Italy; N: number; NR: not reported; NZ: New Zealand; PRECISE: PREvention of Cancer by Intervention with Selenium SD: standard deviation; Suppl‐I: inorganic selenium supplement; Suppl‐O: organic selenium supplement; T3: triiodothyronine; T4: thyroxine; TSH: thyroid‐stimulating hormone, UK: United Kingdom.
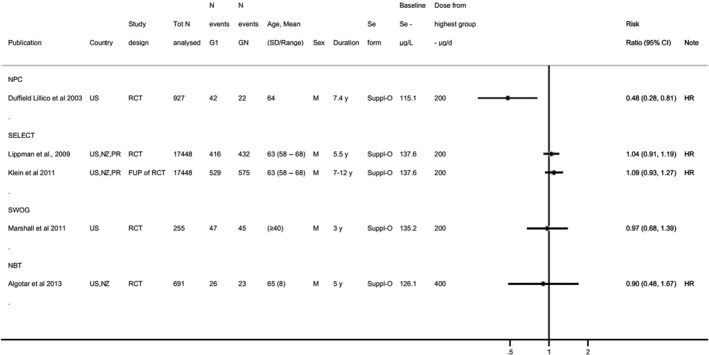
CI: confidence interval; duration: duration of the intervention and follow‐up phase for studies with an observational period (i.e. Klein et al., 2011); FUP: follow‐up; GN: highest dose group from each study; HR: hazard ratio; M: males; NBT: Negative Biopsy Trial; NPC: Nutritional Prevention of Cancer; NZ: New Zealand; PR: Porto Rico; RCT: randomised controlled trial; SD: standard deviation; SELECT: Selenium and Vitamin E Cancer Prevention Trial; Suppl‐O: organic selenium supplement; SWOG: Southwest Oncology Group; US: United States; y: years.
Notes: For Algotar et al. (2013b), HR adjusted for age at baseline, race, baseline PSA, and baseline plasma Se concentration; for Duffield‐Lillico et al. (2003a), HR adjusted for age and smoking.
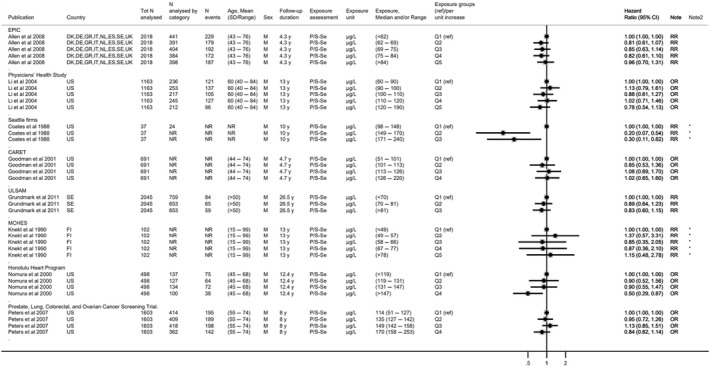
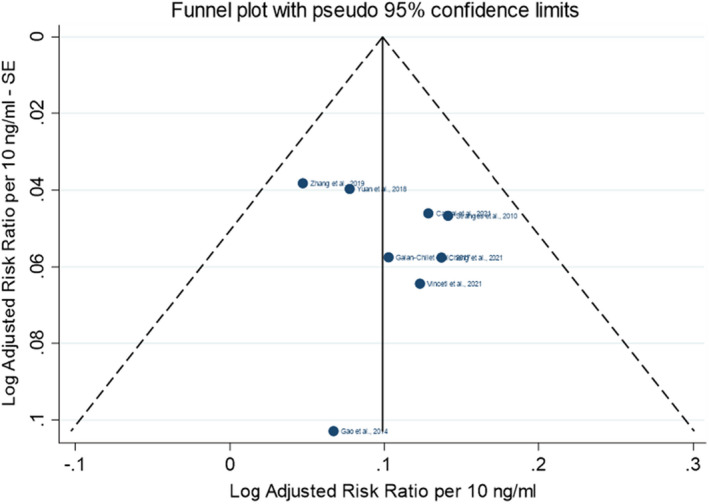
*Denotes imputed standard error.CI: confidence interval; CA: Canada; CARET: Carotene and Retinol Efficacy Trial; DE: Germany; DK: Denmark; EPIC: European Prospective Investigation into Cancer and Nutrition; ES: Spain; FI: Finland; GR: Greece; IT: Italy; M: males; MCHES: Mobile Clinic Health Examination Survey; N: number; NL: The Netherlands; N: number NR: not reported; OR: odds ratio; P/S‐Se: plasma/serum Se; Q: quantile; RR: risk ratio; SD: standard deviation; SE: Sweden; UK: United Kingdom; ULSAM: Uppsala Longitudinal Study of Adult Men; US: United States; y: years.
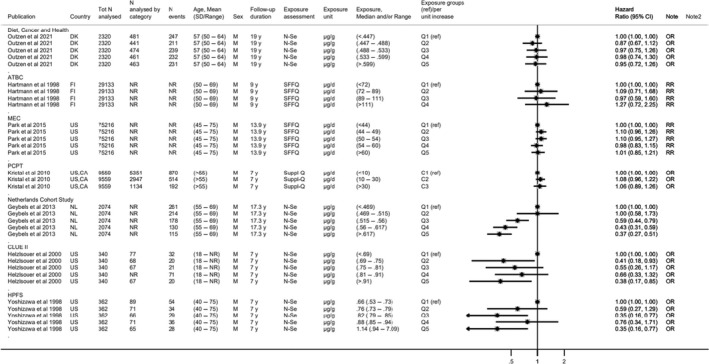
ATBC: Alpha‐Tocopherol, Beta‐Carotene Cancer Prevention; C: category; CA: Canada; CI: confidence interval; d: day; DK: Denmark; FI: Finland; HPFS: Health Professionals Follow‐Up Study; M: males; MEC: Multiethnic Cohort; N: number; NL: Netherlands; N‐Se: nail selenium; NR: not reported; OR: odds ratio; P/S‐Se: plasma/serum selenium; PCPT: Prostate Cancer Prevention Trial; Q: quantile; RR: risk ratio; SFFQ: semiquantitative food frequency questionnaire; Suppl‐Q: supplement use questionnaire; US: United States, y: years.Note: For Kristal et al., stratified results plotted for incidence of prostate cancer for Gleason scores 2–7 (stratified results for Gleason scores 8–10 available in evidence table in Appendix D.7.2).
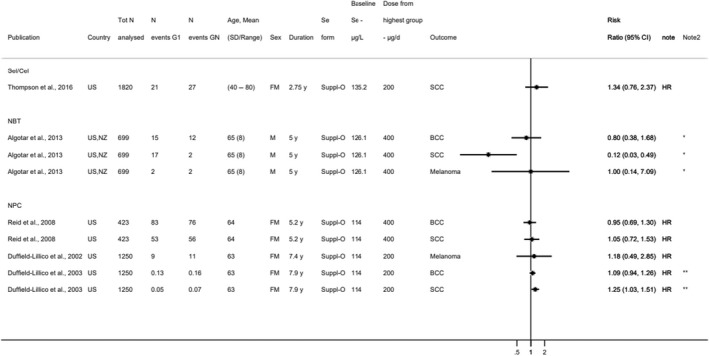
*Denotes estimated risk ratios and standard errors; **denotes incidence rates instead of N events.BCC: basal cell carcinoma; CI: confidence interval; FM: females and males; GN: highest dose group from each study; HR: hazard ratio; N: number; NBT: Negative Biopsy Trial; NPC: Nutritional Prevention of Cancer; NZ: New Zealand; SCC: squamous cell carcinoma; SD: standard deviation; Sel/Cel: Selenium and Celecoxib; Suppl‐O: organic Se supplement; US: United States: y: years.Note: Participants in the NPC trial were at high risk of non‐melanoma skin cancer at baseline having been diagnosed with 1 or more SCC or 2 or more BCC within the year prior to randomization.
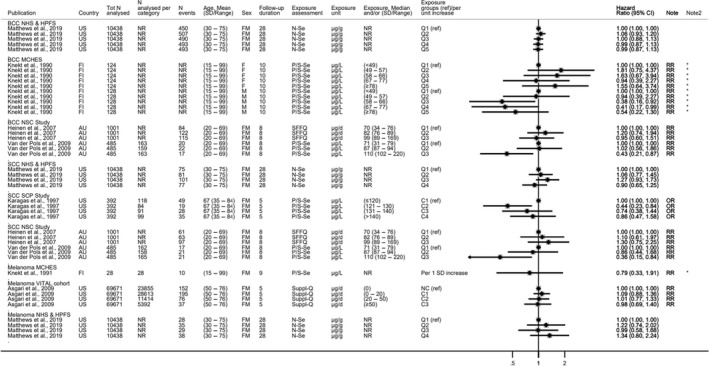
*Denotes imputed standard error.AU: Australia; BCC: basal cell carcinoma; C: category; CI: confidence interval; d: day; FI: Finland; FM: females and males; HPFS: Health Professionals Follow‐Up Study; MCHES: Mobile Clinic Health Examination Survey; N: number; NCC: nested case–control study; NHS: Nurses' Health Study; NR: not reported; NSC: Nambour Skin Cancer; N‐Se: nail selenium; OR: odds ratio; P/S‐Se: plasma/serum selenium; Q: quantile; RR: risk ratio; SD: standard deviation; SCC: squamous cell carcinoma; SCP: Skin Cancer Prevention; SFFQ: semiquantitative food frequency questionnaire; Suppl‐Q: supplement use questionnaire; UK: United Kingdom: VITAL: VITamins And Lifestyle.Notes: Knekt et al. (1991) and Karagas et al. (1997) are NCCs; Karagas et al. (1997) enrolled participants with at least one BCC or SCC cancer previously removed.

*Denotes estimated risk ratios and standard errors.CA: Canada; CI: confidence interval; d: day; FM: females and males; G: group; HR: hazard ratio; N: number; PR: Puerto Rico; SD: standard deviation; Suppl‐O: organic selenium supplement; US: United States; y: years.Note: In Karp et al. (2013): the ratio of participants assigned to G1 and G2 was 1:2: i.e. 521 individuals in the control group and 1:040 individuals in treatment group.
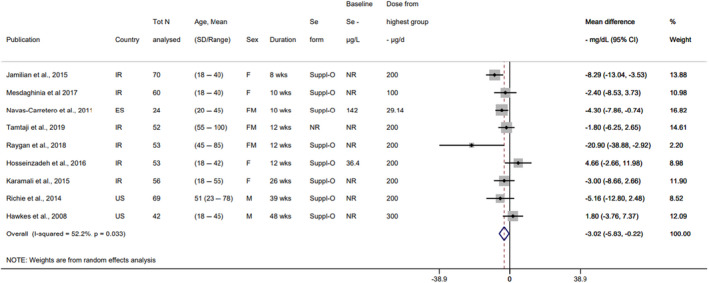
CI: confidence interval; d: day; ES: Spain; FM: females and males; IR: Iran; N: number; NR: not reported; SD: standard deviation; Se: selenium; Suppl‐O: organic selenium supplement; US: United States; wks: weeks.Notes: Baseline selenium intake estimated with six 24‐h recalls in Hosseinzadeh et al. (2016) (in μg/day). Baseline selenium measured in whole blood in Navas‐Carretero et al. (2011) (in μg/L).
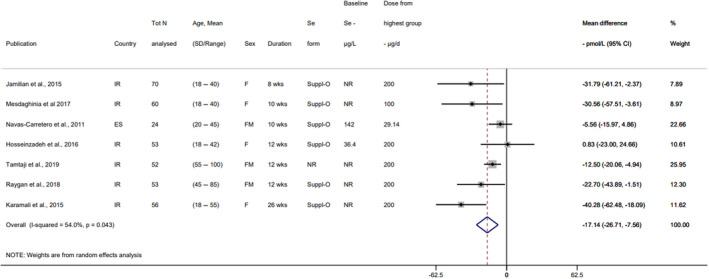
CI: confidence interval; d: day; ES: Spain; FM: females and males; IR: Iran; N: number; NR: not reported; SD: standard deviation; Se: selenium; Suppl‐O: organic selenium supplement; wks: weeks.Notes: Baseline selenium intake estimated with six 24‐h recalls in Hosseinzadeh et al. (2016) (in μg/day). Baseline selenium measured in whole blood in Navas‐Carretero et al. (2011) (in μg/L).
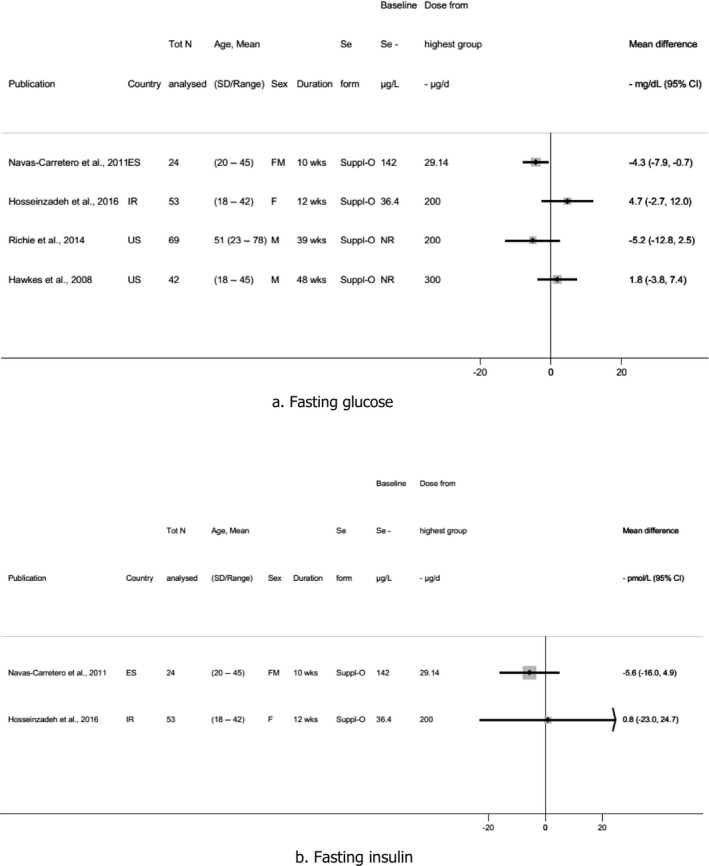
CI: confidence interval; d: day; ES: Spain; FM: females and males; IR: Iran; N: number; NR: not reported; SD: standard deviation; Se: selenium; Suppl‐O: organic selenium supplement; US: United States; wks: weeks.Notes: Baseline selenium intake estimated with six 24‐h recalls in Hosseinzadeh et al. (2016) (in μg/day). Baseline selenium measured in whole blood in Navas‐Carretero et al. (2011) (in μg/L).
C: category: CI: confidence interval; CN: China; d: day; DE: Germany; EPIC: European Prospective Investigation into Cancer and Nutrition; ES: Spain; IT: Italy; N: number; NR: not reported; FM: females and males; SD: standard deviation; SE: Sweden; OR: Odds Ratio; ORDET: HORmones and Diet in the ETioliogy of Breast Cancer; P/S‐Se: plasma/serum selenium; Q: quantile; ref: reference; SFFQ: semiquantitative food frequency questionnaire; T‐Se: toenail selenium; ULSAM: Uppsala Longitudinal Study of Adult Men; US: United States; y: years.Note: For Stranges et al., : N analysed refers to total number of participants.
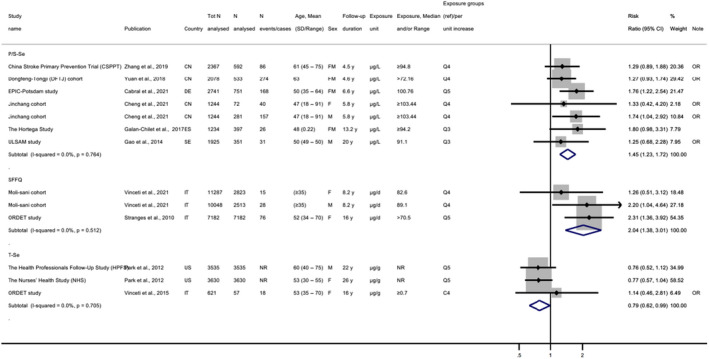
C: category; CI: confidence interval; CN: China; d: day; DE: Germany; EPIC: European Prospective Investigation into Cancer and Nutrition; ES: Spain; FM: females and males; IT: Italy; N: number; NR: not reported; ORDET: HORmones and Diet in the ETioliogy of Breast Cancer; P/S‐Se: plasma/serum selenium; SD: standard deviation; SE: Sweden; SFFQ: food frequency questionnaire; T‐Se: toenail selenium; OR: Odds Ratio; ULSAM: Uppsala Longitudinal Study of Adult Men; US: United States: y: years.Note: For Stranges et al., : N analysed refers to total number of participants.

*Denotes estimated risk ratio and standard error.CI: confidence interval; d: day; duration: duration of the intervention and follow‐up phase for studies with an observational period (i.e. Klein et al., ; Rayman et al., 2018); DK: Denmark; FM: females and males; FUP: follow‐up; GN: highest dose group from each study; HR: hazard ratio; NBT: Negative Biopsy Trial; NZ: New Zealand; PR: Puerto Rico; PRECISE: PREvention of Cancer by Intervention with Selenium; RCT: randomised controlled trial; SD: standard deviation; Se: selenium; SELECT: Selenium and Vitamin E Cancer Prevention Trial; Suppl‐O: organic selenium supplements; SWOG: Southwest Oncology Group; US: United States; y: years.
*Denotes Q1 vs Q2‐Q3‐Q4.
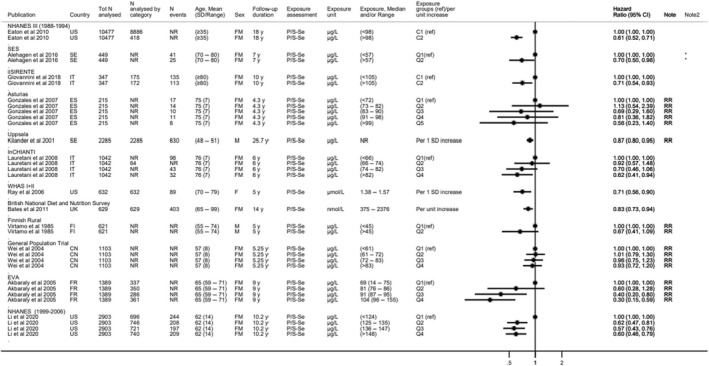
C: category; CI: confidence interval; CN: China; ES: Spain; EVA: Étude du Vieillissement Artériel; FI: Finland; FM: females and males; FR: France; ilSIRENTE: Invecchiamento e Longevità nel Sirente; InCHIANTI: Invecchiare in Chianti; IT: Italy; N: number; NHANES: National Health and Nutrition Examination Survey; NR: not reported; P/S‐Se: plasma/serum selenium; Q: quantile; ref: reference; RR: risk ratio; SD: standard deviation; SE: Sweden; Se: selenium; SES: cohort in the south‐east of Sweden; UK: United Kingdom; US: United States; WHAS: Women's Health and Aging Studies; y: years.
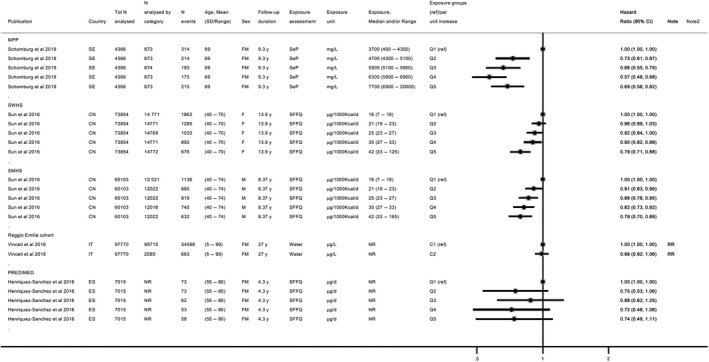
C: category; CI: confidence interval; CN: China; d: day; ES: Spain; FM: females and males; IT: Italy; MPP: Malmö Preventive Project; N: number; NR: not reported; PREDIMED: Prevención con Dieta Mediterránea; Q: quantile; ref: reference; RR: risk ratio; SD: standard deviation; SE: Sweden; SeP: selenoprotein P; SFFQ: semiquantitative food frequency questionnaire; SWHS: Shanghai Women's Health; SMHS: Shanghai Men's Health study; y: years.
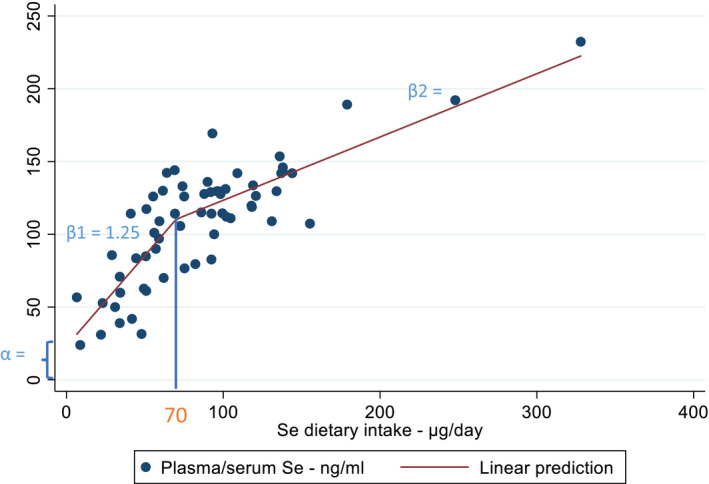
Note: 26 articles identified from the search for sQ1 were included in the dose–response plasma‐intake modelling.
Note: 17 studies identified through the search addressing sQ2 were included in the dose–response analysis for plasma‐intake.
Similar articles
-
Scientific opinion on the tolerable upper intake level for vitamin B6.EFSA J. 2023 May 17;21(5):e08006. doi: 10.2903/j.efsa.2023.8006. eCollection 2023 May. EFSA J. 2023. PMID: 37207271 Free PMC article.
-
Scientific opinion on the tolerable upper intake level for vitamin D, including the derivation of a conversion factor for calcidiol monohydrate.EFSA J. 2023 Aug 8;21(8):e08145. doi: 10.2903/j.efsa.2023.8145. eCollection 2023 Aug. EFSA J. 2023. PMID: 37560437 Free PMC article.
-
Scientific opinion on the tolerable upper intake level for preformed vitamin A and β-carotene.EFSA J. 2024 Jun 6;22(6):e8814. doi: 10.2903/j.efsa.2024.8814. eCollection 2024 Jun. EFSA J. 2024. PMID: 38846679 Free PMC article.
-
Safety and nutritional assessment of GM plants and derived food and feed: the role of animal feeding trials.Food Chem Toxicol. 2008 Mar;46 Suppl 1:S2-70. doi: 10.1016/j.fct.2008.02.008. Epub 2008 Feb 13. Food Chem Toxicol. 2008. PMID: 18328408 Review.
-
The antioxidants--vitamin C,vitamin E, selenium, and carotenoids.J Agromedicine. 2003;9(1):65-82. doi: 10.1300/J096v09n01_07. J Agromedicine. 2003. PMID: 14563626 Review.
Cited by
-
Selenium intake and multiple health-related outcomes: an umbrella review of meta-analyses.Front Nutr. 2023 Sep 13;10:1263853. doi: 10.3389/fnut.2023.1263853. eCollection 2023. Front Nutr. 2023. PMID: 37781125 Free PMC article. Review.
-
Blood Selenium Concentrations Are Inversely Associated with the Risk of Undernutrition in Older Adults.Nutrients. 2023 Nov 10;15(22):4750. doi: 10.3390/nu15224750. Nutrients. 2023. PMID: 38004143 Free PMC article.
-
Toxic Elements in Sheep Milk, Whey, and Cheese from the Environmentally Burdened Area in Eastern Slovakia and Health Risk Assessment with Different Scenarios of Their Consumption.Toxics. 2024 Jun 27;12(7):467. doi: 10.3390/toxics12070467. Toxics. 2024. PMID: 39058119 Free PMC article.
-
A U-shaped association between selenium intake and cancer risk.Sci Rep. 2024 Sep 13;14(1):21378. doi: 10.1038/s41598-024-66553-5. Sci Rep. 2024. PMID: 39271688 Free PMC article.
-
Selenium - a scoping review for Nordic Nutrition Recommendations 2023.Food Nutr Res. 2023 Dec 28;67. doi: 10.29219/fnr.v67.10320. eCollection 2023. Food Nutr Res. 2023. PMID: 38187789 Free PMC article.
References
-
- AECOSAN (Agencia Española de Consumo, Seguridad Alimentaria y Nutrición) , 2017. Estudio ENALIA 2012–2014: Encuesta Nacional de consumo de Alimentos en población Infantil y Adolescente. Ministerio de Sanidad, Servicios Sociales e Igualdad, Madrid. 258 p.
-
- AFSSA (Agence française de sécurité sanitaire des aliments) , 2009. Étude individuelle nationale des consommations alimentaires 2 (INCA 2) 2006–2007 (version 2). Maisons‐Alfort, France. 225 p.
LinkOut - more resources
Full Text Sources