Clinical Trial
. 2023 Feb 16;91(2):e0032322.
doi: 10.1128/iai.00323-22. Epub 2023 Jan 23.

TGF-β/IFN-γ Antagonism in Subversion and Self-Defense of Phase II Coxiella burnetii - Infected Dendritic Cells

Affiliations
Clinical Trial

TGF-β/IFN-γ Antagonism in Subversion and Self-Defense of Phase II Coxiella burnetii - Infected Dendritic Cells

Svea Matthiesen et al. Infect Immun. .

Abstract

Dendritic cells (DCs) belong to the first line of innate defense and come into early contact with invading pathogens, including the zoonotic bacterium Coxiella burnetii, the causative agent of Q fever. However, the pathogen-host cell interactions in C. burnetii-infected DCs, particularly the role of mechanisms of immune subversion beyond virulent phase I lipopolysaccharide (LPS), as well as the contribution of cellular self-defense strategies, are not understood. Using phase II Coxiella-infected DCs, we show that impairment of DC maturation and MHC I downregulation is caused by autocrine release and action of immunosuppressive transforming growth factor-β (TGF-β). Our study demonstrates that IFN-γ reverses TGF-β impairment of maturation/MHC I presentation in infected DCs and activates bacterial elimination, predominantly by inducing iNOS/NO. Induced NO synthesis strongly affects bacterial growth and infectivity. Moreover, our studies hint that Coxiella-infected DCs might be able to protect themselves from mitotoxic NO by switching from oxidative phosphorylation to glycolysis, thus ensuring survival in self-defense against C. burnetii. Our results provide new insights into DC subversion by Coxiella and the IFN-γ-mediated targeting of C. burnetii during early steps in the innate immune response.

Keywords: Coxiella burnetii; immune subversion; major histocompatibility complex.


Conflict of interest statement

The authors declare no conflict of interest.

Figures

FIG 1
FIG 1
PhII C. burnetii infection causes MHC I- and cytokine/chemokine downregulation in DCs. (A) Western blot of DC lysates (non-infected/infected JAWS II, MOI 10/48-96 hpi) stained for coxHSP60 (top). GAPDH was used as loading control. coxHSP60 signals were quantified by densitometric analysis (bottom). The background values in control cells at 0 hpi were set to 0.1 (**, P < 0.01; ****, P < 0.0001 versus 0 hpi cell lysate; n = 3 ± SD). Immunofluorescence of C. burnetii (red) infected JAWS II (72 hpi) is shown as an inset (DNA is stained via DAPI [blue]). (B) Flow cytometry of surface MHC I on C. psittaci- (left, MOI 10, 48 hpi) and C. burnetii-infected (right, MOI 10, 72 hpi) JAWS II cells. Isotype and non-infected controls were included. (C) Western blot of MHC I expression in non-infected and C. burnetii-infected JAWS II cells (MOI 10, 72 hpi) (left). GAPDH was used as loading control. MHC signals were quantified by densitometric analysis (right). The signal in non-infected cells was set to 1 (****, P < 0.0001 versus control [non-infected]; n = 6 ± SD). (D) Profile of secreted cytokines/chemokines during C. burnetii infection of DCs. JAWS II were infected for 72 h with C. psittaci (MOI 10, 48 hpi) or C. burnetii (MOI 10, 72 hpi). Non-infected cells served as control. Secretion of various cytokines/chemokines (i.e., TNF-α, IL-6, IL-1α, and RANTES) was analyzed by cytokine/chemokine multiplex array. The values obtained for non-infected cells were set to 0.1. (n.s.; ***, P < 0.001 versus control; n = 3 ± SD).
FIG 2
FIG 2
TGF-β/αVβ8-mediated suppression of MHC I in PhII C. burnetii-infected DCs. (A) TGF-β secretion by non-infected and infected JAWS II (0-72 hpi, MOI 10) was measured by ELISA. Non-infected cells served as a negative control (n.s.; *, P < 0.05; **, P < 0.01; ***, P < 0.001 versus control [0 to 72 h]; n = 3 ± SD). (B) Effect of TGF-β-neutralization on MHC-I expression. Western blots of C. burnetii- and non-infected JAWS II (MOI 10, 72 hpi) in the presence of TGF-β-neutralizing or isotype/control antibodies (left) were stained for MHC I. GAPDH was used as loading control. MHC I signals were quantified by densitometric analysis (right). MHC I signals obtained for non-infected cells treated with control antibodies were set to 1. (n.s.; **, P < 0.01 versus non-infected or infected controls; n = 3 ± SD). (C) Effect of TGF-β neutralization on cytokine/chemokine secretion by Coxiella-infected DCs. JAWS II were infected with C. burnetii (MOI 10, 72 hpi) in the presence of TGF-β-neutralizing or isotype/control antibodies. Secretion of TNF-α, IL-6, IL-1α, and RANTES was analyzed using a cytokine/chemokine multiplex array. The values for infected control cells were set to 0.1 (***, P < 0.001 versus control; n = 3 ± SD). (D) αVβ8-integrin expression in Coxiella-infected DCs. JAWS II were infected with C. burnetii (MOI 10, 72 hpi) or left uninfected (left). GAPDH served as loading control. αVβ8-signals were measured by densitometry (right). The αVβ8-signal in non-infected cells was set to 1 (*, P < 0.05 versus non-infected control; n = 3 ± SD).
FIG 3
FIG 3
IFN-γ-mediated rescue of MHC I presentation in PhII C. burnetii-infected DCs. (A) CD119 (IFNGR1) surface expression. C. burnetii-infected (MOI 10, 72 hpi) or uninfected JAWS II cells were analyzed by flow cytometry for CD119 (IFNGR1) surface expression. Isotype controls with non-infected cell were included. (B) MHC I expression. C. burnetii- (MOI 10) and non-infected JAWS II were cultured in the presence or absence of IFN-γ (12 hai/7 hpi). MHC I expression levels were analyzed at 72 hpi via Western blot (top). GAPDH was used as loading control. MHC I signals were quantified by densitometry (bottom). Untreated non-infected cells were set to 1 (**, P < 0.01; ***, P < 0.001 versus non-infected or infected untreated control; n = 3 ± SD). (C) αVβ8-integrin expression. C. burnetii- (MOI 10) and non-infected JAWS II in the presence or absence of IFN-γ (12 hai/7 hpi) 72 hpi were analyzed by Western blotting for αVβ8-integrin expression (left). GAPDH served as loading control. αVβ8-integrin signals were quantified by densitometry (right). The signal of untreated cells was set to 1 (****, P < 0.0001 versus infected control; n = 3 ± SD). (D) Surface MHC I expression. C. burnetii-infected (MOI 10, 72 hpi) or non-infected JAWS II (+/− IFN-γ, 12 hai/7 hpi) cells were analyzed by flow cytometry. Isotype controls were included. (E) Immunofluorescence analysis of surface MHC I expression (green) and intracellular C. burnetii antigen (red) in non-infected and infected (MOI 10, 72 hpi) JAWS II (+/− IFN-γ, 12 hai/7 hpi). DNA was stained via DAPI (blue). (F) Peptide spectra of eluted MHC I-bound antigens (sketched on the left) from C. burnetii-infected DCs in the presence of IFN-γ. The red boxes and insets of magnified spectrum regions show 2 identified MHCI-bound peptides of C. burnetii (LAGLINAI, CBU_0933, and LGANVIPVL, CBU_1155) detected at 784.501 and 895.565 m/z, respectively. (G) Cytokine/chemokine secretion. JAWS II cells were either infected with C. burnetii (MOI 10, 72 hpi) or left uninfected in the presence or absence (untreated) of IFN-γ (7 hpi). Secretion of TNF-α, IL-6, IL-1α, and RANTES was analyzed using a cytokine/chemokine multiplex array. The values for non-infected cells were set to 0.1 (***, P < 0.001 versus control; n = 3 ± SD).
FIG 4
FIG 4
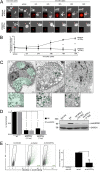
IFN-γ-induced cellular self-defense in PhII C. burnetii-infected DCs. (A) Long-term time-lapse image series of C. burnetii infection in DCs. 1 × 104 DCs were infected with C. burnetii (MOI 50) in the absence (top) or presence (bottom) of IFN-γ. LCI was started 1 h post uptake, and continued for about 60 h at 37°C in a heated chamber. Time-lapse image series were acquired with a Leica THUNDER imager (10× magnification, imaging interval, 15 min; frame rate, 4 frames per hour; scale bar, 75 μm). Images show an overlay of fluorescence and phase-contrast images. Insets show enlargements of the fluorescence, corresponding to the analyzed bacterial structures (red, arrowheads) before/after cellular uptake. LCI movies of the depicted image sequences are available on request. (B) Quantification of the relative fluorescence intensity of intracellular C. burnetii antigen following infection in the presence or absence of IFN-γ during long-term time-lapse recording. ImageJ was used to measure the fluorescence intensity in the respective red fluorescence images. Fourteen infected host cells (7 each in the presence or absence of IFN-γ) were used to quantify Coxiella-fluorescence signals. The measurement was started after bacterial uptake by DCs, and continued in 12 h intervals up to 60 h post uptake. (*, P < 0.05; **, P < 0.01 versus IFN-γ-treated cells; n = 7 ± SD). (C) TEM of C. burnetii-infected JAWS II cells (MOI 10) after 72 hpi in the absence of IFN-γ (left) or with IFN-γ treatment either 12 hai (middle) or 7 hpi (right). Enlarged photographs of the white-framed sections show the morphology/structure of the intracellular bacteria (colored green). (D) Analysis of genome content and coxHSP60 expression. C. burnetii (MOI 10) infection was performed in JAWS II cells in the presence or absence of IFN-γ (added either 12 hai or 7 hpi, as indicated). Genome equivalents (GEs) were quantified following gDNA isolation and qPCR (based on C. burnetii dotA/T4SS) (left). coxHSP60 expression was densitometrically analyzed via Western blot (non-infected cells were included as a negative control, and samples were normalized to GAPDH) (left). The results are plotted as relative bacterial load (each n = 3 ± SD, **, P < 0.01 versus control [- IFN-γ]). A representative Western blot stained for coxHSP60 is shown (right). (E) Impact of IFN-γ on the infectivity of C. burnetii isolated from DCs. JAWS II were infected with C. burnetii (MOI 10, 72 hpi), and treated or not with IFN-γ (7 hpi). Subsequently, intracellular bacteria were prepared by host cell homogenization and used to infect L929 reporter cells (for a further 72 h). The analysis of re-infection was performed by flow cytometry. To detect/quantify C. burnetii-positive cells (green), the negative cell population (black) was identified and gated based on corresponding non-infected controls and then subtracted from the total cell population in infected samples (left). The corresponding quantification (right) shows the relative amount of re-infected reporter cells. Re-infected controls from untreated infected DCs were set to 1 (****, P < 0.0001 versus re-infected control; n = 9 ± SD).
FIG 5
FIG 5
IFN-γ-induced iNOS/NO in infected DCs counteracts bacterial growth and subversion of DC function. (A) PCR analysis of cytochrome bd (cydA-2, cydA-1, cydB) transcript levels. JAWS II cells were infected with C. burnetii (MOI 10) and treated or untreated with IFN-γ (added 7 hpi) for 72 hpi. mRNA expression levels for cytochrome bd (cydA-2, cydA-1, cydB) were normalized to the relative bacterial load (based on GEs and coxHSP60 levels), and untreated controls were set to 1 (***, P < 0.001; ****, P < 0.0001 versus infected control; n = 3 ± SD). (B) iNOS expression in DCs before/after IFN-γ stimulation. C. burnetii- (MOI 10) and non-infected JAWS II cells were cultured in the presence or absence of IFN-γ (12 hai/7 hpi). iNOS expression was analyzed at 72 hpi via Western blot (top). GAPDH and coxHSP60 were used as loading and infection controls, respectively. iNOS signals were quantified by densitometry (bottom). The background signals in untreated cells (non-infected/infected) were set to 1 (***, P < 0.001; ****, P < 0.0001 versus control [non-infected/infected]; n = 3 ± SD). (C) Quantification of nitrite during C. burnetii infection in DCs. C. burnetii-infected JAWS II cells (MOI 10) were incubated in the presence and absence of IFN-γ (7 hpi) for 24 to 72 h. At different time points, supernatants were analyzed by Griess assay. Non-infected cells served as a negative control (*, P < 0.05 versus control [non-infected/IFN-γ, 72 h]; ***, P < 0.001 versus control [non-infected/IFN-γ, 48 h]; **, P < 0.01 versus infected control [72 hpi]; ***, P < 0.001 versus control [non-infected, 48 h and 72 h]; ****, P < 0.0001 versus control [infected, 48 hpi]; n = 3 ± SD). (D) Effect of NO on C. burnetii infection in DCs. JAWS II cells were infected with C. burnetii (MOI 10) and cultured in the presence or absence of a NO producer (DETA NONOate, 100 μM, 7 hpi) for 72 h. A representative Western blot stained for coxHSP60 is shown (inset). GAPDH served as loading control. coxHSP60 signals were quantified by densitometry. The signal of untreated infected cells was set to 1 (**, P < 0.01 versus infected control; n = 3 ± SD). (E) Fluorescence analysis of endogenous NO production. JAWS II cells were infected with C. burnetii (MOI 10, 72 hpi) in the presence (left) or absence (right) of IFN-γ (7 hpi). Bacterial antigen (red) and NO production were stained (DAF-2 DA, green). DNA was stained via DAPI (blue). The insert in the left image shows a magnified subsection and highlights the co-localization between the NO marker and bacterial structures. (F) JAWS II cells were infected with C. burnetii (MOI 10, 72 hpi) in the presence or absence of a TGF-β neutralizing antibody. Cell lysates were analyzed by Western blots stained for iNOS and coxHSP60. GAPH was used as loading control. Signals were quantified by densitometry (iNOS left; coxHSP60 right) and normalized to the loading control (bottom). Signal values of iNOS (inf./α-TGF-β) and coxHSP60 (inf./control) were set to 1 (***, P < 0.001 versus infected controls; n = 3 ± SD).
FIG 6
FIG 6
Bacterial subversion and IFN-γ-based rescue of DC function in PhII C. burnetii-infected primary murine BMDCs. (A) Immunofluorescence analysis of the C. burnetii infection. JAWS II cells (left) or primary BMDCs were infected with C. burnetii (MOI 10, 72 hpi). Bacterial structures were stained in red. DNA was stained via DAPI in blue. (B) MHC I and iNOS expression in primary BMDCs. C. burnetii- (MOI 10) and non-infected primary BMDCs were treated or untreated (untr.) with IFN-γ (added 7 hpi). MHC I and iNOS expressions were analyzed at 72 hpi via Western blot (top). GAPDH was used as loading control. The signals were quantified by densitometry (MHC I, lower right; iNOS, lower left). Untreated cells (either non-infected or infected) were set to 1 (**, P < 0.01 versus controls without IFN-γ; n = 3 ± SD). (C) Fluorescence analysis of NO production. Primary BMDCs were infected with C. burnetii (MOI 10, 72 hpi). Bacterial structures (red) and NO (DAF-2 DA, green) were stained. DNA was stained via DAPI (blue). The separate channels for Coxiella, DAF-2 DA, and DAPI staining are shown at the sides of the respective merged image. (D) Impact of IFN-γ and NO on the infectivity of C. burnetii isolated from primary BMDCs. Primary BMDCs were infected with C. burnetii (MOI 10), treated with either IFN-γ (7 hpi) or an NO donor (DETA NONOate, 100 μM, 7 hpi), or were left untreated. At 72 hpi, intracellular bacteria were prepared by host cell homogenization and used to re-infect reporter L929 cells (for a further 72 h). The analysis of re-infection was performed by flow cytometry of Coxiella-stained reporter cells. To detect/quantify C. burnetii-positive cells (green), the negative cell population (black) was identified and gated in non-infected controls and then subtracted from the total cell population in infected samples (top). The corresponding plot (bottom) shows the relative amount of re-infected reporter cells. Cells re-infected with bacterial extracts lacking IFN-γ or NO donor were used as controls, and the number of Coxiella-positive re-infected cells was set to 1 (***, P < 0.001 versus control; n = 3 ± SD).
FIG 7
FIG 7
iNOS/NO is key in the IFN-γ-mediated defense of PhII Coxiella-infected DCs. (A) coxHSP60 expression of infected after IFN-γ stimulation. Non-infected and C. burnetii-infected (MOI 10) WT- and NOS2-KO-DCs were cultured in the presence or absence of IFN-γ (7 hpi). coxHSP60 expression was analyzed at 72 hpi via Western blot (left). GAPDH was used as loading control. Signals were quantified by densitometry (right). Untreated and infected DCs (WT and NOS2-KO) were set to 1 (***, P < 0.001 versus control [WT infected/IFN-γ]; n = 3 ± SD). (B) Immunofluorescence analysis of C. burnetii infection in WT- and NOS2-KO-DCs. C. burnetii-infected (MOI 10, 72 hpi) or non-infected WT- and NOS2-KO-DCs in the presence or absence of IFN-γ were stained for bacterial structures (red). DNA was stained via DAPI (blue). The immunofluorescence images (and corresponding insets of untreated cells) show the impact of IFN-γ on C. burnetii isolated from WT- and NOS2-KO-DCs. (C) WT- and NOS2-KO-cells were infected with C. burnetii (MOI 10), treated or not with IFN-γ (7 hpi). At 72 hpi, intracellular bacteria were prepared by host cell homogenization and used to re-infect L929 reporter cells (72 h). The analysis was performed by flow cytometry. The bar plot shows the relative amount of re-infected reporter cells. Untreated re-infected controls (WT inf. and NOS2-KO inf.) were set to 1 (***, P < 0.001 versus control [WT inf./IFN-γ and NOS2-KO inf./FN-γ]; n = 3 ± SD). (D) TEM of C. burnetii-infected (MOI 10) WT- (top) and NOS2-KO-DCs (bottom) in the presence (right) or absence (left) of IFN-γ (7 hpi). Bacterial structures/vacuoles were colored in green. (E) Fluorescence analysis of autophagosomes in C. burnetii-infected WT- and NOS2-KO-DCs. C. burnetii-infected (MOI 10, 72 hpi) WT- and NOS2-KO-DCs were treated or untreated (untr.) with IFN-γ (added 7 hpi). Cells were stained for bacterial structures (red) as well as with monodansylcadaverine (MDC, green) for autophagosome detection (left). In addition to the merged images, the individual channels are displayed on the side. The lower left insets in the merged images show untreated control infections. The number of MDC-positive vacuoles in WT- and NOS2-KO-DCs was quantified using ImageJ for 30 individual cells per condition (middle). The Pearson correlation coefficient was determined using the AxioVision software (Zeiss) (right) to analyze the co-localization between bacteria and MDC staining (n.s.; **, P < 0.01 versus control [WT-DCs infected with or without IFN-γ]; n = 30 ± SD).
FIG 8
FIG 8
Cellular self-protection by DCs against mitotoxic NO effects. (A) Intact and defective mitochondria. A JC-1-flow cytometry assay analyzed cellular mitochondrial activity/inactivity in IFN-γ-treated WT- and NOS2-KO-DCs (left part). JC-1 emits red fluorescence in cells with intact mitochondria, while the fluorescence is green when mitochondria are defective. The dashed line shows the average value of the mitochondrial JC-1 ratio (red/green) of control cells without infection and IFN-γ treatment. The corresponding plot (right) shows the ratio of healthy and defective mitochondria (****, P < 0.0001 versus control [WT/IFN-γ]; n = 3 ± SD). (B) HIF-1α expression. Non-infected and C. burnetii-infected WT- and NOS2-KO-DCs (MOI 10) were cultured in the presence or absence of IFN-γ (7 hpi). Protein expression for HIF-1α was analyzed at 72 hpi via Western blot (top panel). GAPDH served as loading control. HIF-1α signals were quantified by densitometry (WT and NOS2-KO, bottom panel). Untreated cells (infected WT and NOS2-KO) were set to 1 (*, P < 0.05; ***, P < 0.001 versus non-infected or infected control; n = 3 ± SD). (C) Quantification of lactate. Non-infected and C. burnetii-infected WT- and NOS2-KO-DCs (MOI 10, 72 hpi) in the presence or absence of IFN-γ (added 7 hpi) were analyzed for lactate content using ELISA (n.s.; **, P < 0.01 versus control [WT or NOS2-KO, non-infected or infected]; n = 3 ± SD).
FIG 9
FIG 9
Working model of subversion and cellular self-defense in C. burnetii-infected DCs. C. burnetii infection in DCs leads to a subversion of proper DC function via αVβ8-integrin upregulation and subsequent autocrine TGF-β release. Both iNOS/NO-mediated defense and MHC I presentation are impaired. This leads to conditions that support bacterial growth and CCV formation. However, the presence of IFN-γ released by activated NK cells reduces surface expression of αVβ8-integrin, which attenuates autocrine TGF-β action. Consequently, it allows efficient MHC I presentation, TNF-α release, and cellular self-defense against C. burnetii via iNOS/NO. This then prevents CCV formation and blocks bacterial growth. At the same time, Coxiella-infected DCs might protect themselves to some extent from the mitotoxic effects of NO production by switching from oxidative phosphorylation to glycolysis. Further studies are required to get more insight into this phenomenon.

Similar articles

Cited by

References

    1. Kapsenberg ML. 2003. Dendritic-cell control of pathogen-driven T-cell polarization. Nat Rev Immunol 3:984–993. 10.1038/nri1246. - DOI - PubMed
    1. Wang Y, Xiong X, Wu D, Wang X, Wen B. 2011. Efficient activation of T cells by human monocyte-derived dendritic cells (HMDCs) pulsed with Coxiella burnetii outer membrane protein Com1 but not by HspB-pulsed HMDCs. BMC Immunol 12:52. 10.1186/1471-2172-12-52. - DOI - PMC - PubMed
    1. Rock KL. 2006. Exiting the outside world for cross-presentation. Immunity 25:523–525. 10.1016/j.immuni.2006.09.003. - DOI - PubMed
    1. Bogdan C. 2001. Nitric oxide and the immune response. Nat Immunol 2:907–916. 10.1038/ni1001-907. - DOI - PubMed
    1. Khavkin T, Tabibzadeh SS. 1988. Histologic, immunofluorescence, and electron microscopic study of infectious process in mouse lung after intranasal challenge with Coxiella burnetii. Infect Immun 56:1792–1799. 10.1128/iai.56.7.1792-1799.1988. - DOI - PMC - PubMed

Publication types

Substances