

Interrelation of T cell cytokines and autoantibodies in systemic lupus erythematosus: A cross-sectional study
- PMID: 36682593
- PMCID: PMC10118038
- DOI: 10.1016/j.clim.2023.109239
Interrelation of T cell cytokines and autoantibodies in systemic lupus erythematosus: A cross-sectional study
Abstract
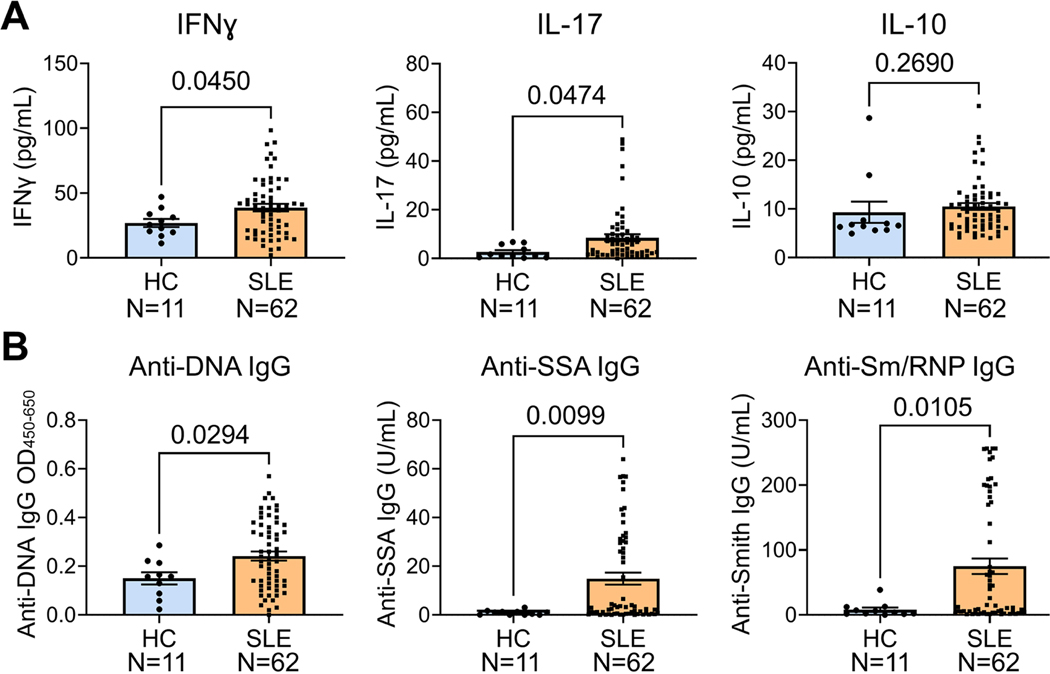
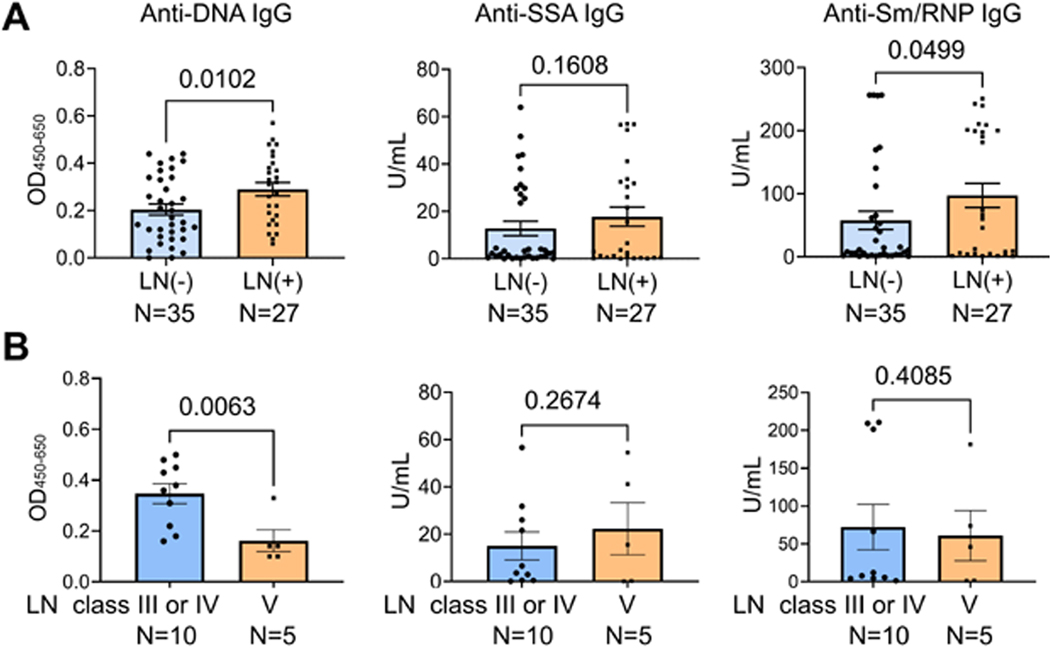
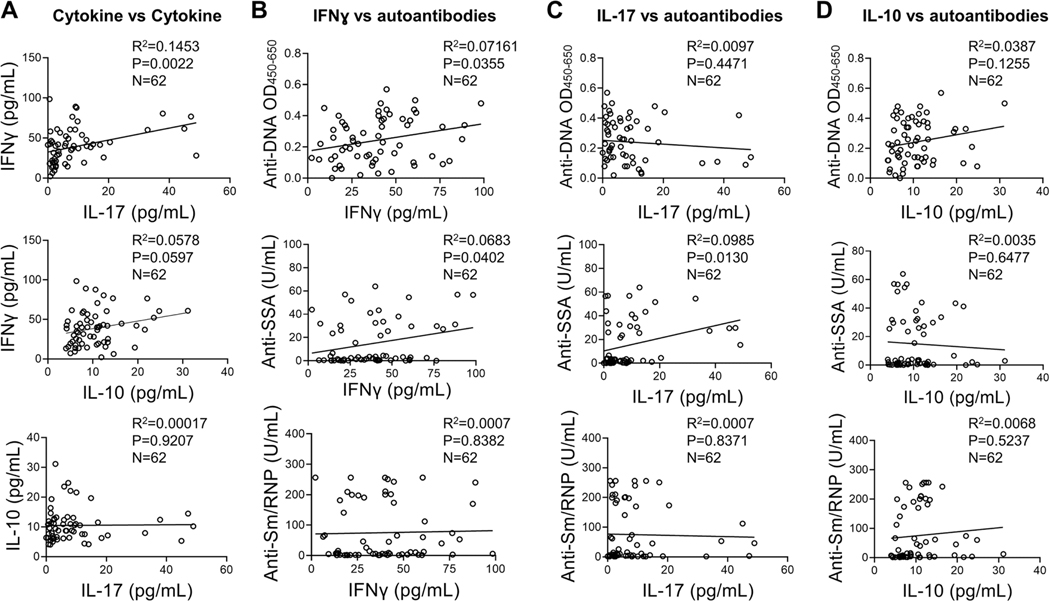
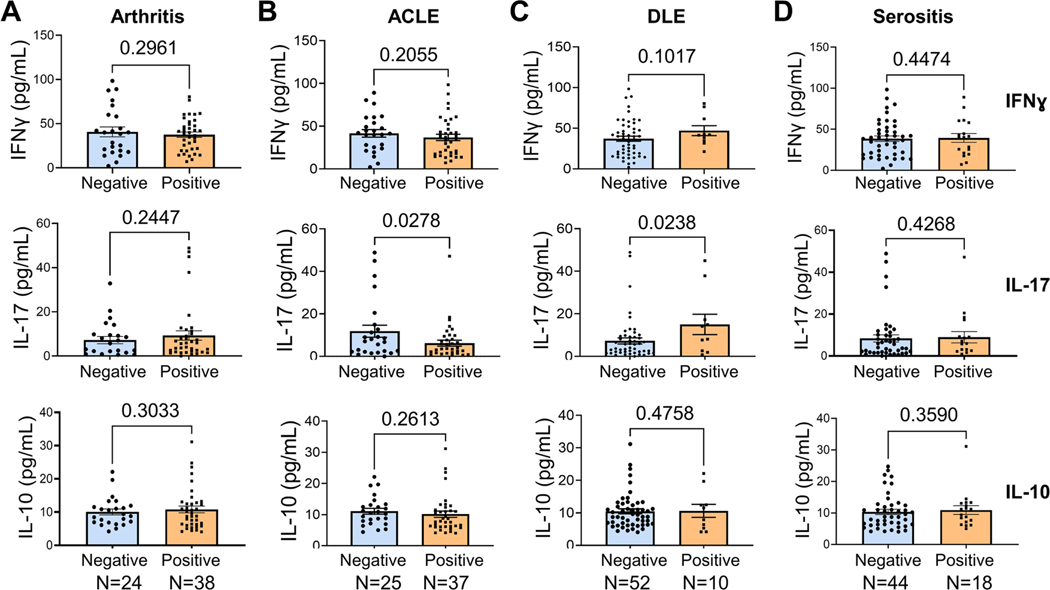
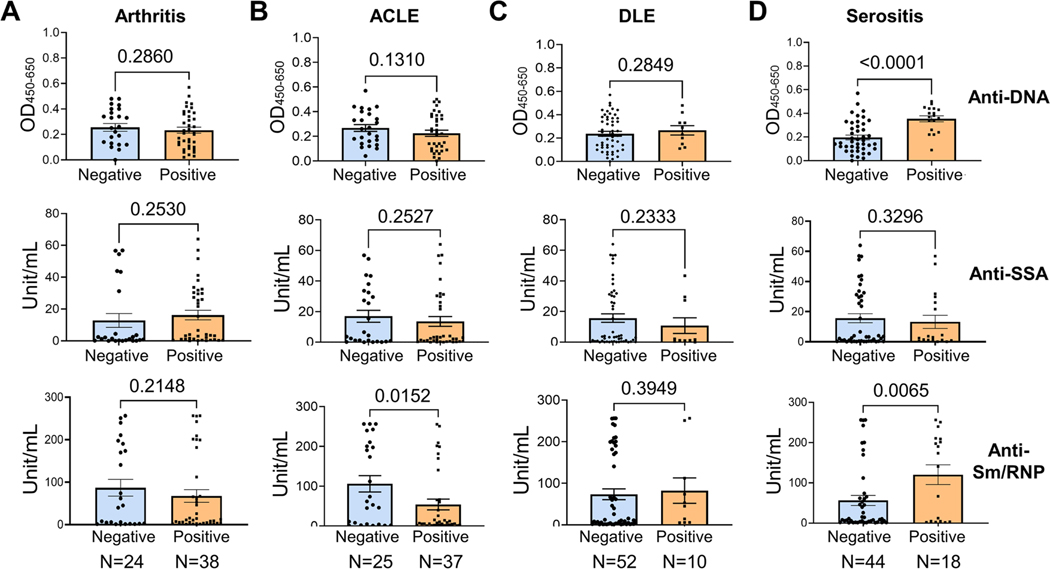
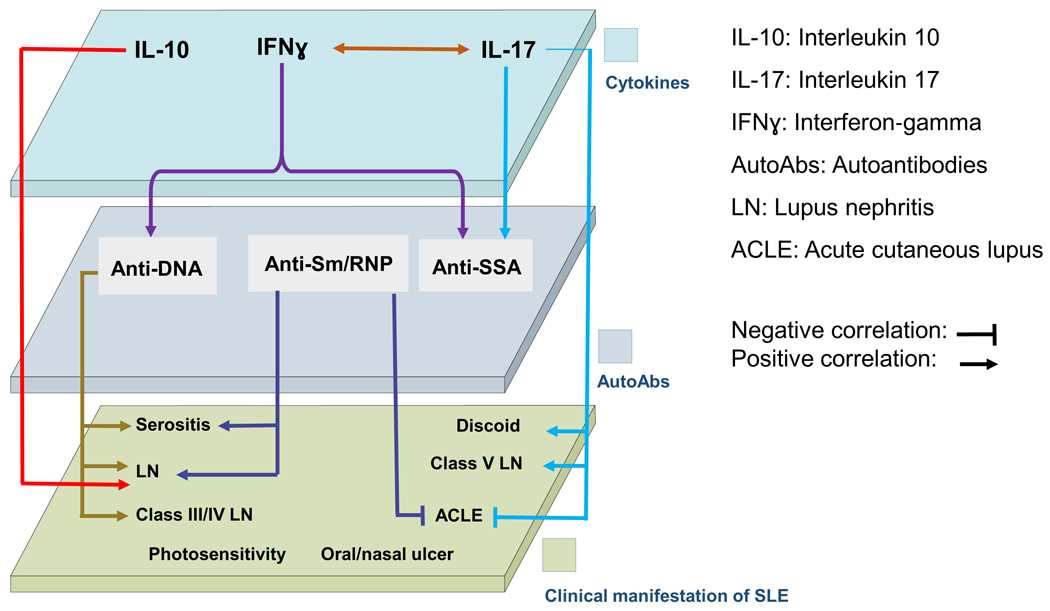
T-helper cytokines interferon gamma (IFNɣ), interleukin 17 (IL-17) and IL-10 impact systemic lupus erythematosus (SLE) directly and indirectly via modulation of autoAb production. We determined the separate and combined effects on clinical manifestations of SLE (N = 62). IFNɣ, IL-17 but not IL-10 were significantly elevated in patients with SLE. IFNɣ positively correlated with anti-DNA and anti-SSA. IL-17 positively correlated with anti-SSA and was significantly higher in patients with discoid rash and class V LN. IL-10 did not correlate with circulating autoantibodies but was significantly elevated in patients with LN. Patients with LN had elevated plasma levels of anti-DNA and anti-Sm/ribonuclear protein (RNP). Anti-Sm/RNP levels were decreased in patients with acute mucocutaneous manifestations, including photosensitivity and/or malar rash. The study provides critical insights into pathological mechanisms of LN, which could help guide future diagnoses and therapies.
Keywords: Interferon gamma; Interleukin 10; Interleukin 17; Lupus nephritis; Systemic lupus erythematosus.
Published by Elsevier Inc.
Conflict of interest statement
Declaration of Competing Interest None. The authors declare that there is no conflict of interest.
Figures

Similar articles
-
Allogeneic cord blood regulatory T cells decrease dsDNA antibody and improve albuminuria in systemic lupus erythematosus.Front Immunol. 2023 Sep 5;14:1217121. doi: 10.3389/fimmu.2023.1217121. eCollection 2023. Front Immunol. 2023. PMID: 37736101 Free PMC article.
-
Increased CD38 expression in T cells and circulating anti-CD38 IgG autoantibodies differentially correlate with distinct cytokine profiles and disease activity in systemic lupus erythematosus patients.Cytokine. 2013 May;62(2):232-43. doi: 10.1016/j.cyto.2013.02.023. Epub 2013 Mar 26. Cytokine. 2013. PMID: 23538292
-
T cell cytokine imbalance towards production of IFN-gamma and IL-10 in NZB/W F1 lupus-prone mice is associated with autoantibody levels and nephritis.Scand J Rheumatol. 2006 May-Jun;35(3):209-16. doi: 10.1080/03009740500417791. Scand J Rheumatol. 2006. PMID: 16766368
-
Anti-RO/SSA and anti-La/SSB antibodies: Association with mild lupus manifestations in 645 childhood-onset systemic lupus erythematosus.Autoimmun Rev. 2017 Feb;16(2):132-135. doi: 10.1016/j.autrev.2016.12.004. Epub 2016 Dec 14. Autoimmun Rev. 2017. PMID: 27988434 Review.
-
Pathogenesis of renal disease in systemic lupus erythematosus--the role of autoantibodies and lymphocytes subset abnormalities.Int J Mol Sci. 2015 Apr 9;16(4):7917-31. doi: 10.3390/ijms16047917. Int J Mol Sci. 2015. PMID: 25860947 Free PMC article. Review.
Cited by
-
Lymphocyte apoptosis and its association with the inflammatory markers and disease severity in juvenile-onset systemic lupus erythematosus patients.Pediatr Rheumatol Online J. 2024 Jan 19;22(1):20. doi: 10.1186/s12969-024-00953-9. Pediatr Rheumatol Online J. 2024. PMID: 38243322 Free PMC article.
-
Lupus Nephritis Biomarkers: A Critical Review.Int J Mol Sci. 2024 Jan 9;25(2):805. doi: 10.3390/ijms25020805. Int J Mol Sci. 2024. PMID: 38255879 Free PMC article. Review.
-
Systemic exposure to bacterial amyloid curli alters the gut mucosal immune response and the microbiome, exacerbating Salmonella-induced arthritis.Gut Microbes. 2023 Jan-Dec;15(1):2221813. doi: 10.1080/19490976.2023.2221813. Gut Microbes. 2023. PMID: 37317012 Free PMC article.
References
-
- Mason LJ, Isenberg DA, Immunopathogenesis of SLE, Baillieres Clin Rheumatol, 12 (1998) 385–403. - PubMed
-
- Balow JE, Clinical presentation and monitoring of lupus nephritis, Lupus, 14 (2005) 25–30. - PubMed
-
- Lopez R, Davidson JE, Beeby MD, Egger PJ, Isenberg DA, Lupus disease activity and the risk of subsequent organ damage and mortality in a large lupus cohort, Rheumatology (Oxford), 51 (2012) 491–498. - PubMed
-
- Bajema IM, Wilhelmus S, Alpers CE, Bruijn JA, Colvin RB, Cook HT, D’Agati VD, Ferrario F, Haas M, Jennette JC, Joh K, Nast CC, Noël LH, Rijnink EC, Roberts ISD, Seshan SV, Sethi S, Fogo AB, Revision of the International Society of Nephrology/Renal Pathology Society classification for lupus nephritis: clarification of definitions, and modified National Institutes of Health activity and chronicity indices, Kidney Int, 93 (2018) 789–796. - PubMed
Publication types
MeSH terms
Substances
Supplementary concepts
Grants and funding
LinkOut - more resources
Full Text Sources
Medical
Research Materials
