TGF-Beta Modulates the Integrity of the Blood Brain Barrier In Vitro, and Is Associated with Metabolic Alterations in Pericytes
- PMID: 36672722
- PMCID: PMC9855966
- DOI: 10.3390/biomedicines11010214
TGF-Beta Modulates the Integrity of the Blood Brain Barrier In Vitro, and Is Associated with Metabolic Alterations in Pericytes
Abstract
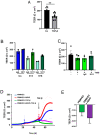
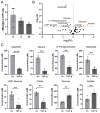
The blood-brain barrier (BBB) is a selectively permeable boundary that separates the circulating blood from the extracellular fluid of the brain and is an essential component for brain homeostasis. In glioblastoma (GBM), the BBB of peritumoral vessels is often disrupted. Pericytes, being important to maintaining BBB integrity, can be functionally modified by GBM cells which induce proliferation and cell motility via the TGF-β-mediated induction of central epithelial to mesenchymal transition (EMT) factors. We demonstrate that pericytes strengthen the integrity of the BBB in primary endothelial cell/pericyte co-cultures as an in vitro BBB model, using TEER measurement of the barrier integrity. In contrast, this effect was abrogated by TGF-β or conditioned medium from TGF-β secreting GBM cells, leading to the disruption of a so far intact and tight BBB. TGF-β notably changed the metabolic behavior of pericytes, by shutting down the TCA cycle, driving energy generation from oxidative phosphorylation towards glycolysis, and by modulating pathways that are necessary for the biosynthesis of molecules used for proliferation and cell division. Combined metabolomic and transcriptomic analyses further underscored that the observed functional and metabolic changes of TGF-β-treated pericytes are closely connected with their role as important supporting cells during angiogenic processes.
Keywords: blood–brain barrier; glioblastoma; metabolomics; transforming growth factor beta.
Conflict of interest statement
C.T. reports a research grant by Bruker BioSpin GmbH, Ettlingen, Germany. All other authors declare no conflict of interest.
Figures


Similar articles
-
TGF-β activates pericytes via induction of the epithelial-to-mesenchymal transition protein SLUG in glioblastoma.Neuropathol Appl Neurobiol. 2021 Oct;47(6):768-780. doi: 10.1111/nan.12714. Epub 2021 May 5. Neuropathol Appl Neurobiol. 2021. PMID: 33780024
-
CD146 coordinates brain endothelial cell-pericyte communication for blood-brain barrier development.Proc Natl Acad Sci U S A. 2017 Sep 5;114(36):E7622-E7631. doi: 10.1073/pnas.1710848114. Epub 2017 Aug 21. Proc Natl Acad Sci U S A. 2017. PMID: 28827364 Free PMC article.
-
Tissue plasminogen activator disrupts the blood-brain barrier through increasing the inflammatory response mediated by pericytes after cerebral ischemia.Aging (Albany NY). 2019 Nov 18;11(22):10167-10182. doi: 10.18632/aging.102431. Epub 2019 Nov 18. Aging (Albany NY). 2019. PMID: 31740626 Free PMC article.
-
Emerging roles of pericytes in the regulation of the neurovascular unit in health and disease.J Neuroimmune Pharmacol. 2014 Dec;9(5):591-605. doi: 10.1007/s11481-014-9557-x. Epub 2014 Aug 14. J Neuroimmune Pharmacol. 2014. PMID: 25119834 Free PMC article. Review.
-
The role of extracellular matrix alterations in mediating astrocyte damage and pericyte dysfunction in Alzheimer's disease: A comprehensive review.Eur J Neurosci. 2022 Nov;56(9):5453-5475. doi: 10.1111/ejn.15372. Epub 2021 Jul 5. Eur J Neurosci. 2022. PMID: 34182602 Review.
Cited by
-
Cortical plasticity is associated with blood-brain barrier modulation.Elife. 2024 Jul 18;12:RP89611. doi: 10.7554/eLife.89611. Elife. 2024. PMID: 39024007 Free PMC article.
-
High Glucose Increases Lactate and Induces the Transforming Growth Factor Beta-Smad 1/5 Atherogenic Pathway in Primary Human Macrophages.Biomedicines. 2024 Jul 16;12(7):1575. doi: 10.3390/biomedicines12071575. Biomedicines. 2024. PMID: 39062148 Free PMC article.
-
Modulation of blood-tumor barrier transcriptional programs improves intra-tumoral drug delivery and potentiates chemotherapy in GBM.bioRxiv [Preprint]. 2024 Aug 28:2024.08.26.609797. doi: 10.1101/2024.08.26.609797. bioRxiv. 2024. PMID: 39253453 Free PMC article. Preprint.
-
Blocking TGF-β- and Epithelial-to-Mesenchymal Transition (EMT)-mediated activation of vessel-associated mural cells in glioblastoma impacts tumor angiogenesis.Free Neuropathol. 2024 Mar 1;5:5-4. doi: 10.17879/freeneuropathology-2024-5188. eCollection 2024 Jan. Free Neuropathol. 2024. PMID: 38455669 Free PMC article.
-
Differential transcriptome response of blood brain barrier spheroids to neuroinvasive Neisseria and Borrelia.Front Cell Infect Microbiol. 2023 Dec 19;13:1326578. doi: 10.3389/fcimb.2023.1326578. eCollection 2023. Front Cell Infect Microbiol. 2023. PMID: 38179419 Free PMC article.
References
-
- Iorgulescu J.B., Gokhale P.C., Speranza M.C., Eschle B.K., Portras M.J., Wilken M.K., Soroko K.M., Chhoeu C., Knott A., Gao Y., et al. Concurrent Dexamethasone Limits the Clinical Benefit of Immune Checkpoint Blockade in Glioblastoma. Clin. Cancer Res. 2021;27:276–287. doi: 10.1158/1078-0432.CCR-20-2291. - DOI - PMC - PubMed
Grants and funding
LinkOut - more resources
Full Text Sources

