. 2023 Jan 11;15(2):460.
doi: 10.3390/cancers15020460.

Rilotumumab Resistance Acquired by Intracrine Hepatocyte Growth Factor Signaling

Affiliations

Rilotumumab Resistance Acquired by Intracrine Hepatocyte Growth Factor Signaling

Fabiola Cecchi et al. Cancers (Basel). .

Abstract

Drug resistance is a long-standing impediment to effective systemic cancer therapy and acquired drug resistance is a growing problem for molecularly-targeted therapeutics that otherwise have shown unprecedented successes in disease control. The hepatocyte growth factor (HGF)/Met receptor pathway signaling is frequently involved in cancer and has been a subject of targeted drug development for nearly 30 years. To anticipate and study specific resistance mechanisms associated with targeting this pathway, we engineered resistance to the HGF-neutralizing antibody rilotumumab in glioblastoma cells harboring autocrine HGF/Met signaling, a frequent abnormality of this brain cancer in humans. We found that rilotumumab resistance was acquired through an unusual mechanism comprising dramatic HGF overproduction and misfolding, endoplasmic reticulum (ER) stress-response signaling and redirected vesicular trafficking that effectively sequestered rilotumumab and misfolded HGF from native HGF and activated Met. Amplification of MET and HGF genes, with evidence of rapidly acquired intron-less, reverse-transcribed copies in DNA, was also observed. These changes enabled persistent Met pathway activation and improved cell survival under stress conditions. Point mutations in the HGF pathway or other complementary or downstream growth regulatory cascades that are frequently associated with targeted drug resistance in other prevalent cancer types were not observed. Although resistant cells were significantly more malignant, they retained sensitivity to Met kinase inhibition and acquired sensitivity to inhibition of ER stress signaling and cholesterol biosynthesis. Defining this mechanism reveals details of a rapidly acquired yet highly-orchestrated multisystem route of resistance to a selective molecularly-targeted agent and suggests strategies for early detection and effective intervention.

Keywords: Met; acquired drug resistance; glioblastoma; hepatocyte growth factor; rilotumumab.


Conflict of interest statement

Karen Rex, Joanna Schmidt, Daniel Baker, Michael A. Damore, Angela Coxon, and Teresa L. Burgess are current or former employees of Amgen Inc. Authors declare that there are no conflicts of interest.

Figures

Figure 7
Figure 7
Potential route of rilotumumab resistance by production of a non-neutralizable truncated HGF protein. (A) Rilotumumab potently neutralizes Met autophosphorylation (pMet; mean signal intensity, SI ± SD, n = 3) in intact 184B5 cells induced by purified recombinant full-length HGF (squares) but not by the purified recombinant truncated HGF variant NK1 (circles). (B) Relative abundance (fold change vs. U87 MG; right) of all HGF mRNA transcript variants (listed and represented schematically at left) in U87 MG HNR as determined by quantitative PCR. (C) Reduced SDS-PAGE and immunoblot analysis of partial purification and size separation of HGF protein species present in U87 MG/HNR-conditioned media. Starting material (left panel) shows media (“media”) from U87 MG (“U87”) and U87 MG/HNR (“HNR”) contain single-chain (“HGFsc”) and mature HGF heavy-chain (“HGFhc”); an NK1-like protein (“NK1”) similar in size to purified recombinant NK1 (21 kDa, “stds”) is present only in the latter. HGF proteins from U87 MG/HNR media were partially purified using heparin-sepharose (center panel). Starting material before (“load”) and after (“pass”) application to the column are at left; the fraction (“NaCl elution”) eluting at 0.8 M NaCl was then dialyzed and sizing filtration (right panel) separated full-length (retained, “ret”) and truncated HGF (“pass”) forms. (D) Met activation (pMet) by partially purified full-length HGF (left panel, dark gray bars) and truncated HGF (NK1; right panel, dark gray bars) at indicated concentrations (nM) were compared with control media (“C”, light gray bars) and to purified recombinant HGF and NK1 protein standards (white bars). Asterisks indicate a significant difference from control (p < 0.05).
Figure 8
Figure 8
Acquisition of ER stress through HGF protein misfolding in U87 MG/HNR. (A) Reduced SDS-PAGE and immunoblot analysis of U87 MG (“U87”) and U87 MG/HNR (“HNR”) cell extracts for PERK (left panel) and calreticulin (right panel). Cells were extracted with ice-cold buffer containing TX-100 detergent, protease and phosphatase inhibitors before centrifugation to separate soluble (“sup”, left, or “super” right) and insoluble (“pel”, left, or “pellet”, right; these abbreviations also apply to panels (B,C)) cell fractions; insoluble fractions were subsequently solubilized in buffer containing 1% SDS prior to analysis. (B) Left, reduced SDS-PAGE and immunoblot analysis of U87 MG (“U87”) and U87 MG/HNR (“HNR”) TX-100 cell extracts for phospho-EIF2a (“p-eIF2a”; upper panels) and total EIF2α (lower panels); as in panel (A), TX-100 extracts were separated into soluble and insoluble fractions prior to analysis. Right, reduced SDS-PAGE and immunoblot analysis for phospho-EIF2a (upper panel) and total EIF2α (lower panel) for U87 MG/HNR (“HNR”) in the absence (“control”) or presence (“+PERKi”) of the selective PERK antagonist GSK2656157. As in panel (A), TX-100 extracts were separated into soluble and insoluble fractions prior to analysis. (C) Non-reduced (i.e., not treated with dithiothreitol or beta-mercaptoethanol so that disulfide bonds remain intact) SDS-PAGE and immunoblot analysis of U87 MG (“U87”) and U87 MG/HNR (“HNR”) cell TX100 extracts for HGF; as in panel (A), extracts were separated into soluble and insoluble fractions prior to analysis. (D) HGF protein concentration (ng/mL) in U87 MG cell (“U87”, white bars, left y-axis) lysates (“C”) and 24-h-conditioned media (“M”) and U87 MG/HNR cell lysate and media (“HNR”, gray bars, “C” and “M”, respectively, right y-axis). Mean values (ng/mL ± SD) from triplicate samples were normalized to total cell protein. Asterisks indicate a significant difference from control (p < 0.05). All the whole western blot figures can be found in the supplementary materials.
Figure 1
Figure 1
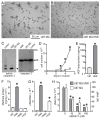
U87 MG and U87 MG/HNR cell morphology, proliferation, HGF, Met and phospho-Met content. Light micrographs of U87 MG (A) and U87 MG/HNR cells (B) in log growth phase. (C) Reduced SDS-PAGE and immunoblot analysis of U87 MG and U87 MG/HNR (“HNR”) cell extracts for activated caspase 3 (17 kDa, left panel) and total caspase 3 protein (36 kDa, right panel). Lanes marked “control” contain positive control proteins for active or intact caspase 3 provided by the antibody manufacturer. (D) Growth rates of U87 MG (squares) and U87 MG/HNR cells (circles) in culture (mean cell number ± SD, n = 3). (E) Secreted HGF protein (mean ng/mg total protein ± SD, n = 3) present in 24 h media from cultured U87 MG (light gray bar, left) or U87 MG/HNR cells (dark gray bar, right). (F) Total Met protein content (mean ng Met/mg total protein ± SD, n = 3) of U87 MG (light gray bar), U87 MG/HNR (dark gray bar) and serum-deprived 184B5 normal human mammary epithelial cells (white bars) in the absence (left) or presence of 1 nM HGF (right). (G) Phospho-Met (pMet) content (mean phosphoMet/total Met signal intensity ratio per mg total protein ± SD, n = 3) of U87 MG (light gray bar), U87 MG/HNR (dark gray bar) and serum-deprived 184B5 cells (white bars) in the absence (left) or presence of 1 nM HGF (right). (H) Phospho-Met (pMet) content (mean phosphoMet/total Met signal intensity ratio per mg total protein ± SD, n = 3) of U87 MG/HNR (gray bars, left Y-axis) and U87 MG (white bars, right Y-axis) in the absence (0) or presence of indicated concentrations (nM) of AMG517, a selective small-molecule Met kinase inhibitor. Asterisks indicate a significant difference from control (p < 0.05). All the whole western blot figures can be found in the supplementary materials.
Figure 2
Figure 2
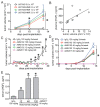
Rilotumumab-resistant U87 MG/HNR cell xenograft growth remains HGF-pathway dependent. (A) Tumor xenograft growth (mean tumor volume ± SEM, n = 10) in mice implanted with U87 MG (circles, 3 × 10⁶ cells/animal) or U87 MG/HNR cells (squares, triangles and inverted triangles) at 0.5, 1 or 3 × 10⁶ cells/animal, respectively. (B) Mean plasma HGF concentration (ng/mL) vs. tumor volume for mice implanted with U87 MG/HNR cells. (A,C) U87 MG tumor xenograft (5 × 10⁶ cells/mouse) growth in mice (mean tumor volume ± SEM, n = 10) treated with control IgG (black circles) or rilotumumab (AMG102) at 12 (green inverted triangles), 40 (blue triangles) or 120 mg/kg (red squares) or compound A at 60 mg/kg (violet circles). (D) U87 MG HNR xenograft growth (0.5 × 10⁶ cells/mouse, mean tumor volume ± SEM, n = 10) in mice treated with control IgG (circles) or rilotumumab (AMG102) at 12 (squares), 40 (triangles) or 120 mg/kg (inverted triangles) or the small-molecule kinase inhibitor AMG517 at 60 mg/kg (diamonds). (E) Mean (±SD) serum HGF concentration (µg/mL) at study termination in U87 MG/HNR tumor-bearing mice treated as in panel (D). Asterisks indicate a significant difference from control (p < 0.05).
Figure 3
Figure 3
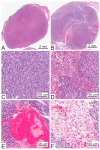
Representative histology of U87 MG and U87 MG/HNR xenograft tumors. Low magnification (1×) of representative tumors derived from (A) U87 MG parental and (B) U87 MG/HNR cells. (C) High magnification (20×) of a U87 MG/HNR tumor illustrating frequent mitotic figures. (D) High magnification (20×) of a U87 MG/HNR tumor showing regions of necrosis. (E) High magnification of a U87 MG/HNR tumor (20×) showing an example of a blood pool. (F) High magnification (20×) of a U87 MG/HNR tumor with an area of serous accumulation and poorly-organized extracellular matrix deposition.
Figure 4
Figure 4
Acquired resistance to rilotumumab by U87 MG xenografts in vivo. (A) U87 MG tumor xenografts grown in mice (n = 10) treated with rilotumumab at 4 mg/kg until day 48 post-implantation and thereafter with 40 mg/kg displayed drug sensitivity (“S”) or acquired drug resistance (“R”) by day 68. (B) Mean HGF content (corrected for total cell protein; ±SD, n = 3), expressed as fold over the parental U87 MG cell line (control), in 24 h media conditioned by 11 cultured cell lines derived from rilotumumab-resistant U87 MG tumor xenografts that were generated as described in panel a. (C) Phospho-Met content (mean signal intensity/mg total protein ± SD, n = 3) in 11 cultured cell lines derived from rilotumumab-resistant U87 MG tumor xenografts in the absence (gray bars) or presence (white bars) of 100 nM AMG517. (D) Dose-dependent inhibition of phospho-Met (mean % maximum ± SD, n = 3) in 11 cultured cell lines derived from rilotumumab-resistant U87 MG tumor xenografts by the selective small-molecule Met kinase inhibitor AMG517. Asterisks indicate a significant difference from control (p < 0.05).
Figure 5
Figure 5
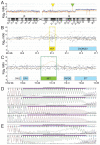
HGF and MET gene amplification and HGF gene promoter DATE region analysis. (A) View of human chromosome 7 CGH microarray analysis results showing moving averages of probe intensity for U87 MG (blue line) or U87 MG/HNR cells (tan line). Inverted triangles indicate the positions of HGF (yellow) and MET (green) genes. Horizontal lines above and below the center indicate probe intensities corresponding to whole copy number changes. (B,C) Zoomed view of chromosome 7 regions encoding the genes for HGF ((B), yellow box) and MET ((C), green box). Other nearby gene loci are indicated by blue boxes. As in (A), moving averages of probe intensities for U87 MG (blue) or U87 MG/HNR cells (tan) are shown. Circles indicate individual probes with intensity values corresponding to gain or loss of less than one gene copy (black) or greater than one gene copy (red). (D) DNA sequencing chromatogram encompassing the DATE region in the HGF gene promoter. Coding strand sequence (green) for U87 MG DNA (top panel) and U87 MG/HNR DNA (second panel from the top) and non-coding strand sequences for each cell line (third and fourth panels from the top, respectively) shown normal DATE region length in both U87 MG and U87 MG/HNR cells. (E) Control samples for DATE sequence truncation (coding strands only) obtained from the leiomyosarcoma cell line SK-LMS-1 (top) and for normal DATE region length obtained from the clear cell renal cell carcinoma cell line UOK331 (bottom).
Figure 6
Figure 6
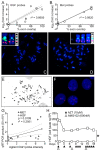
HGF and MET gene CGH array probe analysis, FISH, qRT-PCR and HGF protein reduction by AZT indicate that amplification involved reverse transcription. Scatter plot of intensity scores (y-axis, log2 (fold increase)) from individual CGH array probes for HGF (A) or MET (B) vs. percent overlap between probe sequence and matching complementary gene exon sequence (x-axis). Linear regression analysis lines (black), 95% confidence intervals (dashed gray lines) and r2 values are shown. FISH analysis of U87 MG (C) and U87 MG/HNR (D); MET probes are red, HGF probes are green and centromeric probes are cyan. Insets in each panel show copies of chromosome 7 adjacent to ideograms of probe locations. Inset for U87 MG/HNR (D) shows double-minute chromosomes positive for HGF only at left. (E) U87 HNR DNA analyzed for metaphases after being cultured for 4 weeks in the presence of rilotumumab; numerous double minute (DM) chromosomes and fragments are visible. (F) FISH probes for HGF (green) and MET (red) hybridized with interphase chromatin show numerous copies of each gene. (G) Scatter plot of Agilent CGH array probe intensities for HGF and MET genes in U87 MG/HNR (x-axis) vs. relative content of qRT-PCR products generated using primers corresponding to CGH probe sequences (y-axis). Linear regression analysis (black line), 95% confidence limits (gray dashed lines), r2 and p values of non-linearity are shown. (H) HGF protein content (ng/mg total protein, y-axis) in samples (n = 3) of cultured U87 MG (circles) or U87 MG/HNR cells (squares) grown for 18 days (x-axis) in the presence of added rilotumumab (open triangles below x-axis) and AZT (closed triangles below x-axis). Error bars (SD) at all time points are not visible because they are smaller than the symbol size. Asterisks indicate a significant difference from control (p < 0.05).
Figure 9
Figure 9
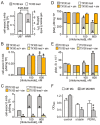
Qualitative and quantitative changes in vesicular trafficking accompany rilotumumab resistance. As in Figure 8, cells were extracted with ice-cold buffer containing TX-100 detergent, protease and phosphatase inhibitors before centrifugation to separate soluble (“sup”, left, or “super” right) and insoluble (“pel”, left, or “pellet”, right) cell fractions; insoluble fractions were subsequently solubilized in buffer containing 1% SDS prior immunoassay analysis (see Methods). (A) Cell-associated mAb (mean uM rilotumumab/mg total protein ± SD, n = 3) measured in U87 MG (“U87”, left y-axis) or U87 MG/HNR (“HNR”, right y-axis) cell Triton X-100 extracts separated into soluble (gray bars) and insoluble (white bars) fractions prepared after 24 h rilotumumab exposure. (B,C): Cell-associated mAb (mean uM rilotumumab/mg total protein ± SD, n = 3) in Triton X-100 soluble (gray or orange bars) and insoluble (white or yellow bars) fractions prepared from U87 MG cells (B) or U87 MG/HNR cells (C) exposed for 16 h to rilotumumab at the indicated concentrations in the absence (gray/white bars) or presence (yellow/orange bars) of simvastatin (2 mM). (D,E): Met protein content ((D), mean pM/mg total protein ± SD, n = 3) and phosphoMet content ((E), mean signal intensity/mg total protein ± SD, n = 3) in U87 MG/HNR cell-derived Triton X-100 extracts separated into soluble (gray or orange bars) and insoluble (white or yellow bars) fractions exposed for 16 h to rilotumumab at the indicated concentrations in the absence (gray/white bars) or presence (yellow/orange bars) of simvastatin (2 mM). (F) Soft agar colony formation by U87 MG (clear bars) or U87 MG/HNR cells (gray bars) left untreated (“control”) or treated with simvastatin (“s’statin”) or the selective PERK inhibitor GSK2656157 (“PERKi”). Values are mean ± SD from triplicate samples, * (p = 0.0024) and ** (p = 0.001) indicate statistical significance as determined by unpaired t-test with Welch’s correction. Asterisks indicate a significant difference from control (p < 0.05).

Similar articles

Cited by

References

    1. Engelman J.A., Zejnullahu K., Mitsudomi T., Song Y., Hyland C., Park J.O., Lindeman N., Gale C.M., Zhao X., Christensen J., et al. MET amplification leads to gefitinib resistance in lung cancer by activating ERBB3 signaling. Science. 2007;316:1039–1043. doi: 10.1126/science.1141478. - DOI - PubMed
    1. Bean J., Brennan C., Shih J.Y., Riely G., Viale A., Wang L., Chitale D., Motoi N., Szoke J., Broderick S., et al. MET amplification occurs with or without T790M mutations in EGFR mutant lung tumors with acquired resistance to gefitinib or erlotinib. Proc. Natl. Acad. Sci. USA. 2007;104:20932–20937. doi: 10.1073/pnas.0710370104. - DOI - PMC - PubMed
    1. Suda K., Murakami I., Katayama T., Tomizawa K., Osada H., Sekido Y., Maehara Y., Yatabe Y., Mitsudomi T. Reciprocal and complementary role of MET amplification and EGFR T790M mutation in acquired resistance to kinase inhibitors in lung cancer. Clin. Cancer Res. 2010;16:5489–5498. doi: 10.1158/1078-0432.CCR-10-1371. - DOI - PubMed
    1. Yano S., Wang W., Li Q., Matsumoto K., Sakurama H., Nakamura T., Ogino H., Kakiuchi S., Hanibuchi M., Nishioka Y., et al. Hepatocyte growth factor induces gefitinib resistance of lung adenocarcinoma with epidermal growth factor receptor-activating mutations. Cancer Res. 2008;68:9479–9487. doi: 10.1158/0008-5472.CAN-08-1643. - DOI - PubMed
    1. Yano S., Yamada T., Takeuchi S., Tachibana K., Minami Y., Yatabe Y., Mitsudomi T., Tanaka H., Kimura T., Kudoh S., et al. Hepatocyte growth factor expression in EGFR mutant lung cancer with intrinsic and acquired resistance to tyrosine kinase inhibitors in a Japanese cohort. J. Thorac. Oncol. 2011;6:2011–2017. doi: 10.1097/JTO.0b013e31823ab0dd. - DOI - PubMed

LinkOut - more resources