A Novel Nanosafety Approach Using Cell Painting, Metabolomics, and Lipidomics Captures the Cellular and Molecular Phenotypes Induced by the Unintentionally Formed Metal-Based (Nano)Particles
- PMID: 36672217
- PMCID: PMC9856453
- DOI: 10.3390/cells12020281
A Novel Nanosafety Approach Using Cell Painting, Metabolomics, and Lipidomics Captures the Cellular and Molecular Phenotypes Induced by the Unintentionally Formed Metal-Based (Nano)Particles
Abstract
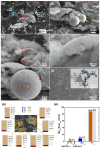
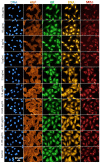
Additive manufacturing (AM) or industrial 3D printing uses cutting-edge technologies and materials to produce a variety of complex products. However, the effects of the unintentionally emitted AM (nano)particles (AMPs) on human cells following inhalation, require further investigations. The physicochemical characterization of the AMPs, extracted from the filter of a Laser Powder Bed Fusion (L-PBF) 3D printer of iron-based materials, disclosed their complexity, in terms of size, shape, and chemistry. Cell Painting, a high-content screening (HCS) assay, was used to detect the subtle morphological changes elicited by the AMPs at the single cell resolution. The profiling of the cell morphological phenotypes, disclosed prominent concentration-dependent effects on the cytoskeleton, mitochondria, and the membranous structures of the cell. Furthermore, lipidomics confirmed that the AMPs induced the extensive membrane remodeling in the lung epithelial and macrophage co-culture cell model. To further elucidate the biological mechanisms of action, the targeted metabolomics unveiled several inflammation-related metabolites regulating the cell response to the AMP exposure. Overall, the AMP exposure led to the internalization, oxidative stress, cytoskeleton disruption, mitochondrial activation, membrane remodeling, and metabolic reprogramming of the lung epithelial cells and macrophages. We propose the approach of integrating Cell Painting with metabolomics and lipidomics, as an advanced nanosafety methodology, increasing the ability to capture the cellular and molecular phenotypes and the relevant biological mechanisms to the (nano)particle exposure.
Keywords: additive manufacturing; high-content screening (HCS); inflammation; multivariate analysis; nanoparticle emissions; new approach methodologies (NAMs); targeted metabolomics.
Conflict of interest statement
Authors H.A. and J.F. are employed by Uddeholms AB. The remaining authors declare that the research was conducted in the absence of any conflict of interest. The funders had no role in the design of the study; in the collection, analyses, or interpretation of the data; in the writing of the manuscript; or in the decision to publish the results.
Figures


Similar articles
-
Integrated Transcriptomics, Metabolomics, and Lipidomics Profiling in Rat Lung, Blood, and Serum for Assessment of Laser Printer-Emitted Nanoparticle Inhalation Exposure-Induced Disease Risks.Int J Mol Sci. 2019 Dec 16;20(24):6348. doi: 10.3390/ijms20246348. Int J Mol Sci. 2019. PMID: 31888290 Free PMC article.
-
Toxicity evaluation of particles formed during 3D-printing: Cytotoxic, genotoxic, and inflammatory response in lung and macrophage models.Toxicology. 2022 Feb 15;467:153100. doi: 10.1016/j.tox.2022.153100. Epub 2022 Jan 12. Toxicology. 2022. PMID: 35032623
-
Immunotoxic, genotoxic, and endocrine disrupting impacts of polyamide microplastic particles and chemicals.Environ Int. 2024 Jan;183:108412. doi: 10.1016/j.envint.2023.108412. Epub 2023 Dec 29. Environ Int. 2024. PMID: 38183898
-
Particle Safety Assessment in Additive Manufacturing: From Exposure Risks to Advanced Toxicology Testing.Front Toxicol. 2022 Apr 25;4:836447. doi: 10.3389/ftox.2022.836447. eCollection 2022. Front Toxicol. 2022. PMID: 35548681 Free PMC article. Review.
-
Recent advances in using mass spectrometry for mitochondrial metabolomics and lipidomics - A review.Anal Chim Acta. 2018 Dec 11;1037:3-12. doi: 10.1016/j.aca.2017.11.080. Epub 2017 Dec 19. Anal Chim Acta. 2018. PMID: 30292306 Review.
Cited by
-
Nanoparticles-induced potential toxicity on human health: Applications, toxicity mechanisms, and evaluation models.MedComm (2020). 2023 Jul 14;4(4):e327. doi: 10.1002/mco2.327. eCollection 2023 Aug. MedComm (2020). 2023. PMID: 37457660 Free PMC article. Review.
-
NLRP3 inflammasome as a sensor of micro- and nanoplastics immunotoxicity.Front Immunol. 2023 Apr 18;14:1178434. doi: 10.3389/fimmu.2023.1178434. eCollection 2023. Front Immunol. 2023. PMID: 37143682 Free PMC article. Review.
-
Assessing biologic/toxicologic effects of extractables from plastic contact materials for advanced therapy manufacturing using cell painting assay and cytotoxicity screening.Sci Rep. 2024 Mar 11;14(1):5933. doi: 10.1038/s41598-024-55952-3. Sci Rep. 2024. PMID: 38467674 Free PMC article.
-
Health hazards of particles in additive manufacturing: a cross-disciplinary study on reactivity, toxicity and occupational exposure to two nickel-based alloys.Sci Rep. 2023 Nov 27;13(1):20846. doi: 10.1038/s41598-023-47884-1. Sci Rep. 2023. PMID: 38012238 Free PMC article.
References
-
- Wong K.V., Hernandez A. A review of additive manufacturing. Int. Sch. Res. Not. 2012;2012:208760. doi: 10.5402/2012/208760. - DOI
-
- Kumar S.P., Elangovan S., Mohanraj R., Ramakrishna J.R. Review on the evolution and technology of State-of-the-Art metal additive manufacturing processes. Mater. Today Proc. 2021;46:7907–7920. doi: 10.1016/j.matpr.2021.02.567. - DOI
-
- Alijagic A., Scherbak N., Kotlyar O., Karlsson P., Persson A., Hedbrant A., Norinder U., Larsson M., Felth J., Andersson L., et al. Cell Painting unveils cell response signatures to (nano) particles formed in additive manufacturing. Toxicol. Lett. 2022;368:S226–S227. doi: 10.1016/j.toxlet.2022.07.611. - DOI
-
- Alijagic A., Engwall M., Särndahl E., Karlsson H., Hedbrant A., Andersson L., Karlsson P., Dalemo M., Scherbak N., Färnlund K., et al. Particle safety assessment in additive manufacturing: From exposure risks to advanced toxicology testing. Front. Toxicol. 2022;4:836447. doi: 10.3389/ftox.2022.836447. - DOI - PMC - PubMed
-
- Runström Eden G., Tinnerberg H., Rosell L., Möller R., Almstrand A.C., Bredberg A. Exploring Methods for Surveillance of Occupational Exposure from Additive Manufacturing in Four Different Industrial Facilities. Ann. Work Expo. Health. 2022;66:163–177. doi: 10.1093/annweh/wxab070. - DOI - PMC - PubMed
Publication types
MeSH terms
Grants and funding
LinkOut - more resources
Full Text Sources

