. 2023 Mar;20(3):408-417.
doi: 10.1038/s41592-022-01753-3. Epub 2023 Jan 19.

Jasmine and Iris: population-scale structural variant comparison and analysis

Affiliations

Jasmine and Iris: population-scale structural variant comparison and analysis

Melanie Kirsche et al. Nat Methods. 2023 Mar.

Abstract

The availability of long reads is revolutionizing studies of structural variants (SVs). However, because SVs vary across individuals and are discovered through imprecise read technologies and methods, they can be difficult to compare. Addressing this, we present Jasmine and Iris ( https://github.com/mkirsche/Jasmine/ ), for fast and accurate SV refinement, comparison and population analysis. Using an SV proximity graph, Jasmine outperforms six widely used comparison methods, including reducing the rate of Mendelian discordance in trio datasets by more than fivefold, and reveals a set of high-confidence de novo SVs confirmed by multiple technologies. We also present a unified callset of 122,813 SVs and 82,379 indels from 31 samples of diverse ancestry sequenced with long reads. We genotype these variants in 1,317 samples from the 1000 Genomes Project and the Genotype-Tissue Expression project with DNA and RNA-sequencing data and assess their widespread impact on gene expression, including within medically relevant genes.


Conflict of interest statement

Competing Interests

S.A. has become an employee at Oxford Nanopore. R.S. has become an employee at Illumina.

Figures

Figure 1:
Figure 1:. SV Inference Pipeline.
This pipeline produces population-level SV calls from FASTQ files using a number of existing methods as well as two novel methods, Iris and Jasmine. Iris uses consensus methods to improve the accuracy of the breakpoints and sequence of insertion SVs. Jasmine uses a graph of SV proximity and a constrained minimum spanning forest algorithm to compare and combine variants across multiple individuals.
Figure 2.
Figure 2.. Mendelian Discordance in the HG002 Ashkenazim Trio.
We called SVs from HiFi data for the Ashkenazim trio consisting of HG002 (son - 46,XY) and parents HG003 (46,XY), and HG004 (46,XX) using several prior methods as well as our pipeline. a.) The number of SVs called in each subset of individuals when using prior methods: ngmlr for alignment, Sniffles for SV calling, and SURVIVOR for consolidating SVs between samples. b.) The number of SVs called in each subset of individuals when using our optimized pipeline. c.) The distribution of variant types and lengths in the HG002 trio with our pipeline. d.) The rate of discordance when comparing SVs between individuals with Jasmine as well as six existing methods for population inference. Jasmine reduces the discordance rate while at the same time addressing issues present in other methods such as merging variants of different types, variants with the same type but corresponding to unique breakpoint adjacencies (mixed strand), or variants within the same sample.
Figure 3.
Figure 3.. SV Inference across Sequencing Technologies in HG002.
We called SVs in HG002 separately from Pacbio CLR data, Oxford Nanopore data, and Pacbio HiFi CCS data, and used Jasmine to compare the variants discovered by each of them. a.) The number of SVs discovered by each subset of technologies. b.) The SV type distribution within each subset of technologies. c.) The distribution of types and lengths among variants for which all of the technologies agree. d-f.) The type and length distributions for variants unique to CLR, ONT, and HiFi respectively.
Figure 4.
Figure 4.. De Novo Variant Discovery in HG002.
We called variants in each of HG002, HG003, and HG004 from three different sequencing technologies - CLR, ONT, and HiFi - to identify potential de novo variants that were called in none of the six parent callsets but one or more of the HG002 callsets. a.) The number of SVs and indels which are absent in all six parent callsets whose presence in HG002 is supported by each subset of technologies. While we manually inspected all SVs supported by HiFi and at least one other technology, both of the examples in (c) and (d) were supported by all three technologies. b.) All variants supported by HiFi and at least one other technology in HG002 that are absent in all parent callsets. The potential de novo variants we identified are highlighted in green, with the microsatellite repeat expansion denoted by an arrow. While filters based on length, read support, and breakpoint standard deviation could be used to filter out many false de novo candidates, the microsatellite repeat expansion is an example of a higher-confidence de novo SV which would be incorrectly filtered out. c.) A potential de novo 107bp deletion in HG002 at chr17:53340465. d.) A potential de novo microsatellite repeat expansion in HG002 at chr14:23280711.
Figure 5.
Figure 5.. Population-Scale Inference from Public Datasets.
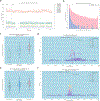
We called SVs and indels with our pipeline in a cohort of 31 samples from diverse ancestries and sequencing technologies and used Jasmine as well as five prior methods to combine the individual samples’ SVs into a population-scale callset. a.) The number of variants obtained with each merging software across 100 runs with the list of input VCFs randomly shuffled each time. b.) The distribution of the range of breakpoints of variant calls merged into single variants by each software, excluding unmerged variants. c.) The number of intrasample merges within single merged variants, defined as the number of variants minus the number of unique samples, for each software. d.) The allele frequency distribution of variants merged by Jasmine. e.) The number of variants discovered by Jasmine as the number of samples increases. f.) The distribution of variant types and lengths in the cohort when using Jasmine. g.) The number of SVs in the cohort in 1Mbp bins across the human genome.
Figure 6.
Figure 6.. Functional impact of SVs from Jasmine.
We used Paragraph to genotype SVs and indels from the cohort of 31 samples in 873 samples from the GTEx Consortium which have RNA-seq data in multiple tissues. We used 48 tissues in our analysis with sufficient samples. a.) Number of variants detected per sample for genotyped SVs and indels (Jasmine) versus SVs reported in the GTEx SV dataset after HWE filtering. Note short read-based SV calls are not available for all samples so some samples only display the counts using Jasmine. b.) Distribution of the number of tissues an SV-gene pair is found as a significant eQTLs (FDR correction at 5%). We further plot the distribution for SV-gene pairs with significant eQTLs where the SV has the maximum CAVIAR score compared to all flanking SNPs. c.) Genotype and gene expression distribution in GTEx samples with expression in testis for the HACL1-associated deletion (n=318). d.) Manhattan plot for SNPs and the novel SV near HACL1, with the log10 p-value measured by a generalized linear model accounting for GTEx covariates. The annotated variant is the top variant, 1_0_16114_del, and points are colored by LD to this variant. For c,d, we used 318 individuals with both SV calls and RNA seq in testis tissue. e.) Genotype and gene expression distribution in GTEx samples with expression in whole blood for DDTL-associated deletion (n=666). f.) Manhattan plot for SNPs and the novel SV near DDTL, with the log10 p-value measured by a generalized linear model accounting for GTEx covariates. The annotated variant is the top variant, 0_0_078802_del, and points are colored by LD to this variant. For e,f, we used 666 individuals with both SV calls and RNA seq in whole blood samples. Examples c and e were selected based on a two-sided t-test to assess nominal p-value of a variant gene pair after gene-level Bonferroni multiple hypothesis testing corrections at FDR 5%. Boxplots describes the 1st to 3rd quartile of the expression z-score distribution and the whiskers describes 1st quartile - 1.5 * IQR and 3rd quartile + 1.5 * IQR centered on the mean expression value of each genotype group.

Similar articles

Cited by

References

    1. Alonge M et al. Major Impacts of Widespread Structural Variation on Gene Expression and Crop Improvement in Tomato. Cell 182, 145–161.e23 (2020). - PMC - PubMed
    1. Alkan C, Coe BP & Eichler EE Genome structural variation discovery and genotyping. Nature Reviews Genetics vol. 12 363–376 Preprint at 10.1038/nrg2958 (2011). - DOI - PMC - PubMed
    1. Chiang C et al. The impact of structural variation on human gene expression. Nature Genetics vol. 49 692–699 Preprint at 10.1038/ng.3834 (2017). - DOI - PMC - PubMed
    1. Aganezov S et al. Comprehensive analysis of structural variants in breast cancer genomes using single-molecule sequencing. Genome Res 30, 1258–1273 (2020). - PMC - PubMed
    1. Nattestad M et al. Complex rearrangements and oncogene amplifications revealed by long-read DNA and RNA sequencing of a breast cancer cell line. Genome Res 28, 1126–1135 (2018). - PMC - PubMed

Publication types