. 2023 Feb 15;133(4):e163612.
doi: 10.1172/JCI163612.

Type 2 diabetes candidate genes, including PAX5, cause impaired insulin secretion in human pancreatic islets

Affiliations

Type 2 diabetes candidate genes, including PAX5, cause impaired insulin secretion in human pancreatic islets

Karl Bacos et al. J Clin Invest. .

Abstract

Type 2 diabetes (T2D) is caused by insufficient insulin secretion from pancreatic β cells. To identify candidate genes contributing to T2D pathophysiology, we studied human pancreatic islets from approximately 300 individuals. We found 395 differentially expressed genes (DEGs) in islets from individuals with T2D, including, to our knowledge, novel (OPRD1, PAX5, TET1) and previously identified (CHL1, GLRA1, IAPP) candidates. A third of the identified expression changes in islets may predispose to diabetes, as expression of these genes associated with HbA1c in individuals not previously diagnosed with T2D. Most DEGs were expressed in human β cells, based on single-cell RNA-Seq data. Additionally, DEGs displayed alterations in open chromatin and associated with T2D SNPs. Mouse KO strains demonstrated that the identified T2D-associated candidate genes regulate glucose homeostasis and body composition in vivo. Functional validation showed that mimicking T2D-associated changes for OPRD1, PAX5, and SLC2A2 impaired insulin secretion. Impairments in Pax5-overexpressing β cells were due to severe mitochondrial dysfunction. Finally, we discovered PAX5 as a potential transcriptional regulator of many T2D-associated DEGs in human islets. Overall, we have identified molecular alterations in human pancreatic islets that contribute to β cell dysfunction in T2D pathophysiology.

Keywords: Beta cells; Diabetes; Endocrinology; Insulin; Metabolism.


Figures

Figure 1
Figure 1. Workflow of RNA-Seq sample filtering.
The LUDC pancreatic islet cohort consists of islet preparations from 309 individuals. RNA-Seq was performed on 283 of these. After quality control (QC) and other filtering, data from 171 preparations were included in the analysis to identify DEGs in islets from individuals with T2D versus ND control islets. Similarly, islet data from 176 preparations were included in the HbA1c analysis.
Figure 2
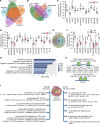
Figure 2. Characterization of the 395 identified DEGs.
(A and B) Venn diagrams showing the overlaps between the DEGs identified in the LUDC islet case-control cohort (LUDC ICCC) and DEGs identified in previous bulk (A) and single-cell (B) expression analyses of human pancreatic islets from T2D and ND donors. (C and D) mRNA expression of selected known (C) and, to our knowledge, novel (D) DEGs identified in pancreatic islets from 33 individuals with T2D and 138 ND controls of the LUDC ICCC. *q < 0.05, **q < 0.01, and ****q < 0.0001, based on a generalized linear model as implemented in DESeq2 (70), with correction for age, sex, islet purity, and DIC. (E) RNA-Seq of sorted α and β cells from 16 ND individuals showed that the vast majority of the 395 identified DEGs were expressed in either or both cell types. (F) mRNA expression of selected genes in sorted α and β cells from islet preparations from 16 ND individuals. **q < 0.01, ***q < 0.001, and ****q < 0.0001, based on a generalized linear model as implemented in DESeq2 (70). (G) Enrichment analysis showed that T2D islet DEGs were enriched for gene ontology terms associated with β cell function. (H) DEGs with an altered chromatin state in islets from ND controls versus individuals with T2D, as identified by ATAC-Seq (15). (I) Left: 148 pancreatic islet eQTLs associated with expression of 120 DEGs as well as T2D risk and metabolic traits. Right: 149 unique SNPs annotated to 106 DEGs were found to associate with T2D or the indicated glucose traits in GWAS. Box-and-whisker plots show the median, 25th and 75th percentiles, and minimum and maximum values. Illustration credit for the islet in Figure 2I: Servier Medical templates.
Figure 3
Figure 3. Mice with KO of genes showing differential expression in pancreatic islets from individuals with T2D exhibit metabolic phenotypes.
(A) Flow chart depicting the IMPC data-mining strategy and an overview of the findings for mice with KO of DEGs identified in the LUDC islet case-control cohort. (B) Summary of IMPC phenotypic data outputs for viable KO mouse strains. Underlined genes were functionally validated in our study, while KO mice for genes in lighter-colored areas show different effects for the indicated phenotype in males and females. IB, insulin blood levels.
Figure 4
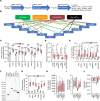
Figure 4. T2D-associated expression changes impair insulin secretion.
(A) Flow chart showing strategy for the selection of DEGs for functional follow-up. (B) Ten of the 11 genes selected for functional analysis have T2D-associated DMRs, INSPIRE eQTLs, SNPs associated with T2D or glucose traits, or islet mQTLs annotated to them. (C) mRNA expression of DEGs selected for functional follow-up. ****q < 0.0001, based on a generalized linear model as implemented in DESeq2 (70), with correction for age, sex, purity, and DIC, on expression data on islets from 138 ND controls and 33 individuals with T2D. (D) qPCR quantification of siRNA-mediated knockdown of CHL1, HHATL, OPRD1, and SLC2A2 in human islets (n = 6–8). (E) Effect of knockdown of CHL1, HHATL1, OPRD1, or SLC2A2 on insulin secretion from human islets (n = 6–8). (D and E) *P < 0.05 compared with negative control siRNA (siNC) at the indicated glucose concentration; 2-tailed, paired t test. (F) Representative Western blot showing overexpression of GFP, Barx1, Nefl, Pax5, Pcolce2, and Sfrp1 in virally transduced INS1 β cells. The experiment was performed 3 times. (GJ) Effect of overexpression on insulin secretion (G) and insulin content (H) in absolute values, insulin secretion presented as fold change (I), and total protein (J) (n = 7). (G) **P < 0.01 compared with GFP at 16.7 mM glucose; #P < 0.05 and ##P < 0.01 compared with GFP at 2.8 mM glucose. (HJ) *P < 0.05 and ****P < 0.0001 compared with GFP. Data in GJ were analyzed by 2-tailed, paired t test. Box-and-whisker plots show the median, 25th and 75th percentiles, and minimum and maximum values.
Figure 5
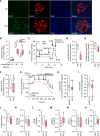
Figure 5. Increased expression of Pax5 results in perturbed mitochondrial activity.
(A) Immunohistochemical staining of human pancreas sections (n = 5 ND; n = 4 T2D) showing increased PAX5 (green) expression in T2D pancreas sections. Most of the expression was confined to β cells, as evidenced by costaining with insulin (red). Nuclei are stained with DAPI (blue). Representative images are shown (original magnification, ×40). (B) Pax5 overexpression blunted GSIS but increased secretion stimulated by elevated K+ (n = 6). (C) OCR in clonal β cells overexpressing GFP or Pax5. The OCR was measured at 2.8 mM glucose (basal respiration) and then after sequential addition of 16.7 mM glucose (glucose-stimulated respiration), 5 μM oligomycin (inhibits ATP synthase), 4 μM carbonyl cyanide p-trifluoromethoxyphenylhydrazone (FCCP, mitochondrial uncoupler), and 1 μM rotenone/antimycin A (electron transport chain inhibitors) (n = 4). (DF) Respiratory response to addition of high glucose (change in respiration compared with basal glucose, D), glucose-stimulated respiration (respiration at high glucose, E), and maximal OCR (respiration after mitochondrial uncoupling, F) (n = 4). (G) PercevalHR trace on INS1 β cells stimulated with 2.8 and 16.7 mM glucose, and after addition of oligomycin (n = 148, pcDNA3.1; n = 213, Pax5). (H and I) Pax5-overexpressing INS1 β cells (n = 213) exhibited a significantly lower increase of the ATP/ADP ratio when glucose was raised to 16.7 mM (average signal between 94 and 354 seconds compared with average signal between 0 and 75 seconds, H), and a greater drop in the ATP/ADP ratio after addition of oligomycin (average signal between 409 and 567 seconds compared with average signal between 94 and 354 seconds, I), when compared with pcDNA3.1-transfected cells (n = 148). (JO) Levels of citrate synthase and subunits of complex I–V of the electron transport chain (n = 6). *P < 0.05, **P < 0.01, and ***P < 0.001, by 2-tailed, paired t test (BF and JO) and 2-tailed, unpaired t test (GI). Box-and-whisker plots show the median, 25th and 75th percentiles, and minimum and maximum values.
Figure 6
Figure 6. Elevated Pax5 in INS1 β cells leads to cell loss and widespread transcriptomic changes affecting β cell function.
(A) Pax5 overexpression resulted in loss of INS1 β cells, as indicated by MTT assay (n = 4). (B and C) Pax5 overexpression in INS1 β cells increased caspase-3/-7 activity (n = 5) (B) and levels of cleaved (i.e., active) caspase-3 (n = 6, all samples were run on 1 gel) (C). (D) Pax5 overexpression reduced proliferation in INS1 β cells (n = 6). (E) mRNA expression of Btbd3, Faim2, Nab1, Pcolce2, Pde7b, Slc2a2, Socs1, and Tgm2 was altered in Pax5-overexpressing INS1 β cells (n = 8). (F) Enrichment of gene ontology terms among the genes with differential expression in Pax5-overexpressing INS1 β cells showed transcriptomic changes within pathways important for insulin secretion and cell numbers. *P < 0.05, **P < 0.01 ***P < 0.001, and ****P < 0.0001, by 2-tailed, paired t test (AE). Box-and-whisker plots show the median, the 25th and 75th percentiles, and minimum and maximum values.
Figure 7
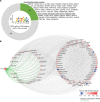
Figure 7. PAX5 is potentially a key T2D DEG overexpressed in β cells.
(A) Graphic showing the number of DEGs with a PAX5-binding motif in the promoter (based on a Pscan analysis) (30) and the proportion of these DEGs that have been shown to have a regulatory role in β cells or have genetic variants associated with T2D or metabolic traits in humans, either in this or other published studies. The PAX5-binding motif is shown in the center. (B) WGCNA (36) coexpression analysis based on weighted correlations among the 395 T2D DEGs showed that PAX5 is part of an expression cluster containing 87 DEGs, with direct connection to 22 DEGs. DE, differential expression.
Figure 8
Figure 8. Schematic image presenting a model for how the T2D-associated changes may alter β cell function.
Our analysis showed that the islet expression of 395 genes is altered in T2D. These expression changes are enriched for genes affecting, e.g., insulin secretion, and functional analyses showed that the T2D-associated changes to OPRD1, PAX5, PCOLCE2, and SLC2A2 (encoding GLUT2) impair glucose-stimulated insulin secretion. In ND individuals, β cells highly express SLC2A2, leading to high levels of GLUT2 and efficient glucose uptake. This in turn, via glycolysis, the TCA cycle, and the electron transport chain (ETC) in well-functioning mitochondria, leads to ATP production, a higher cytosolic ATP/ADP ratio, and stimulation of insulin secretion. Simultaneously, our data suggest that signaling through OPRD1, an enkephalin receptor, stimulates insulin secretion. In T2D, there is dysregulation of PAX5, leading to greatly increased PAX5 mRNA and protein levels in β cells, as well as a severe reduction in SLC2A2 and OPRD1 expression. These changes lead to diminished insulin secretion, with PAX5 overexpression causing a strong reduction in mitochondrial activity. Simultaneously, PCOLCE2 is upregulated, which, through an unknown mechanism, also impairs insulin secretion. Importantly, elevated PAX5 may cause many of the other detrimental expression changes, including reduced SLC2A2 expression. Green arrows indicate stimulation, red arrows indicate inhibition, and dashed arrows indicate potential effects.

Similar articles

Cited by

References

    1. Bugliani M, et al. Microarray analysis of isolated human islet transcriptome in type 2 diabetes and the role of the ubiquitin-proteasome system in pancreatic beta cell dysfunction. Mol Cell Endocrinol. 2013;367(1-2):1–10. doi: 10.1016/j.mce.2012.12.001. - DOI - PubMed
    1. Gunton JE, et al. Loss of ARNT/HIF1beta mediates altered gene expression and pancreatic-islet dysfunction in human type 2 diabetes. Cell. 2005;122(3):337–349. doi: 10.1016/j.cell.2005.05.027. - DOI - PubMed
    1. Lawlor N, et al. Single-cell transcriptomes identify human islet cell signatures and reveal cell-type-specific expression changes in type 2 diabetes. Genome Res. 2017;27(2):208–222. doi: 10.1101/gr.212720.116. - DOI - PMC - PubMed
    1. Olsson AH, et al. Decreased expression of genes involved in oxidative phosphorylation in human pancreatic islets from patients with type 2 diabetes. Eur J Endocrinol. 2011;165(4):589–595. doi: 10.1530/EJE-11-0282. - DOI - PMC - PubMed
    1. Segerstolpe A, et al. Single-cell transcriptome profiling of human pancreatic islets in health and type 2 diabetes. Cell Metab. 2016;24(4):593–607. doi: 10.1016/j.cmet.2016.08.020. - DOI - PMC - PubMed

Publication types

MeSH terms