. 2023 Jan 18;14(1):301.
doi: 10.1038/s41467-022-35716-1.

Revealing the tissue-level complexity of endogenous glucagon-like peptide-1 receptor expression and signaling

Affiliations

Revealing the tissue-level complexity of endogenous glucagon-like peptide-1 receptor expression and signaling

Julia Ast et al. Nat Commun. .

Abstract

The glucagon-like peptide-1 receptor (GLP1R) is a class B G protein-coupled receptor (GPCR) involved in glucose homeostasis and food intake. GLP1R agonists (GLP1RA) are widely used in the treatment of diabetes and obesity, yet visualizing the endogenous localization, organization and dynamics of a GPCR has so far remained out of reach. In the present study, we generate mice harboring an enzyme self-label genome-edited into the endogenous Glp1r locus. We also rationally design and test various fluorescent dyes, spanning cyan to far-red wavelengths, for labeling performance in tissue. By combining these technologies, we show that endogenous GLP1R can be specifically and sensitively detected in primary tissue using multiple colors. Longitudinal analysis of GLP1R dynamics reveals heterogeneous recruitment of neighboring cell subpopulations into signaling and trafficking, with differences observed between GLP1RA classes and dual agonists. At the nanoscopic level, GLP1Rs are found to possess higher organization, undergoing GLP1RA-dependent membrane diffusion. Together, these results show the utility of enzyme self-labels for visualization and interrogation of endogenous proteins, and provide insight into the biology of a class B GPCR in primary cells and tissue.


Conflict of interest statement

J.B. and D.J.H. receive licensing revenue from Celtarys Research for provision of chemical probes. J.B. is a consultant for Vedere Bio II, Inc. The remaining authors declare no competing interests.

Figures
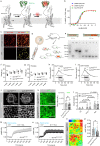
Fig. 1
Fig. 1. Generation and validation of GLP1RSNAP/SNAP mice.
a SNAP-tags react with benzylguanine (BG)-linked substrates, allowing fluorophore labeling. b N-terminal SNAPf does not influence potency of mouse (m)GLP1R cAMP generation versus SNAP-human(h)GLP1R and hGLP1R-GFP constructs (n = 3 replicates). c BG-TMR labels YFP-SNAP_mGLP1R-AD293 cells (scale bar = 205 µm) (representative images from n = 3 replicates). d, e Pronuclear injection of sgRNA and repair template into fertilized Cas9-overexpressing oocytes (d) leads to knock-in of the SNAPf-tag at the Glp1r locus (WT: 110 bp vs. SNAP_mGLP1R: 680 bp) (e) (uncropped agarose gel shows repair template integration in two out of six offspring). f, g Body weight in 4–8 week old male (f) and female (g) GLP1RWT/WT and GLP1RSNAP/SNAP mice (two-way ANOVA with Bonferroni’s test; male F = 0.62, DF = 4; female F = 0.33, DF = 4) (n = 9 male mice; 7 female mice). h, i Oral glucose tolerance in male (h) and female (i) GLP1RWT/WT and GLP1RSNAP/SNAP mice (area under the curve is inset) (two-way RM ANOVA with Bonferroni’s test; male F = 0.50, DF = 5; female F = 0.81, DF = 5) (n = 9 male mice; 7 female mice). j LUXendin645 binds GLP1RWTWT and GLP1RSNAP/SNAP islets (n = 6 islets, 3 animals) (scale bar = 85 µm, zoom-in = 24 µm). k GLP1R expression is similar in islets isolated from GLP1RWT/WT and GLP1RSNAP/SNAP mice (n = 30 islets, 6 animals) (IntDen; integrated density) (scale bar = 42.5 µm). l Glucose- and Exendin4 (Ex4)-stimulated insulin secretion are similar in islets isolated from GLP1RWT/WT and GLP1RSNAP/SNAP mice (comparison within genotype: one-way RM ANOVA with Bonferroni’s test; F (GLP1RWT/WT) = 24.33, F (GLP1RSNAP/SNAP) = 28.46, DF = 2) (comparison between genotype: two-way ANOVA with Bonferroni’s test; F = 1.33, DF = 2) (n = 17 replicates, 3 animals). mp Ex4-stimulated cAMP rises are similar between GLP1RWT/WT (m) and GLP1RSNAP/SNAP (n) mice, shown by representative images (o) and peak intensity between frames 120–360 (p) (n = 3 replicates, 5 animals) (two-sided unpaired t-test). Scale bar = 30 µm. **P < 0.05, **P < 0.01, NS, non-significant. Bar and line graphs show individual datapoints and mean ± SEM. Source data are provided as a Source Data file.
Fig. 2
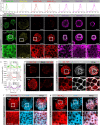
Fig. 2. Rationale comparison of SNAP labels for visualization of endogenous targets in complex tissue.
a Excitation and emission spectra of cyan to far-red dyes tested for tissue labeling. b BG-OG labels GLP1RSNAP/SNAP islets, although some non-specific cytoplasmic accumulation is apparent (n = 12 islets, 4 animals). BG-CPY and BG-Cy5 are unable to specifically label GLP1RSNAP/SNAP islets (n = 13 islets, 4 animals for BG-CPY, n = 15 islets, 6 animals for BG-Cy5). BG-TMR and BG-JF549 lead to bright and specific labeling of GLP1RSNAP/SNAP islets (n = 23 islets, 4 animals for BG-TMR, n = 14 islets, 3 animals for BG-JF549). BG-SiR and BG-JF646 leads to membrane labeling in GLP1RSNAP/SNAP islets, although some non-specific accumulation is seen at the tissue fringe (n = 10 islets, 4 animals for BG-SiR, n = 10 islets, 3 animals for BG-JF646). c Representative line profiles showing membrane labeling by the various SNAP labels in GLP1RSNAP/SNAP islets (gray shaded area shows membranous margins either side of the cell). d Pre-incubation of GLP1RSNAP/SNAP islets with SNAP-Block prevents subsequent labeling with BG-TMR (n = 45 islets, n = 6 animals). e SNAP labeling with BG-TMR co-localizes with orthosteric labeling using LUXendin645 (LUX645) (n = 17 islets, 4 animals). f, g BG-TMR (f) and BG-JF549 (g) labeling co-localizes with GLP1R mAb staining (n = 20 islets, 9 animals). Scale bar = 85 µm for all images, except zoom in scale bar = 17 µm. Source data are provided as a Source Data file.
Fig. 3
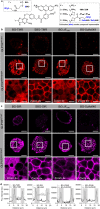
Fig. 3. Validation of cell impermeable rhodamine-bearing SNAP labels for visualization of surface protein endogenous targets in complex tissue.
a Installation of a sulfonate, either on the benzylguanine or the dye itself, renders the SNAP label cell impermeable. b Compared to BG-TMR and BG-JF549, SBG-TMR and BG-Sulfo549 lead to brighter and cleaner surface labeling of GLP1RSNAP/SNAP islets (n = 12 islets, 3 animals for SBG-TMR; n = 16 islets, 3 animals for BG-Sulfo549). c Similar results are observed for SBG-SiR and BG-Sulfo646 versus BG-SiR and BG-JF646 (n = 13 islets, 5 animals for SBG-SiR; n = 7 islets, 4 animals for BG-Sulfo646). d Representative line intensity profiles showing brighter, surface-localized labeling of GLP1RSNAP/SNAP islets with SBG- and Sulfo dyes (gray-shaded area shows membranous margins either side of the cell). Scale bar = 85 µm for all images, except zoom in scale bar = 17 µm. Source data are provided as a Source Data file.
Fig. 4
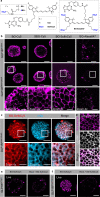
Fig. 4. Validation of cell impermeable cyanine-bearing SNAP labels for visualization of surface protein endogenous targets in complex tissue.
a Installation of a sulfonate, either on the benzylguanine or the dye itself, renders the SNAP label cell impermeable. b Sulfonation of BG-Cy5 allows the dye to label GLP1RSNAP/SNAP islets, with BG-SulfoCy5 showing the best performance compared to SBG-Cy5. The related cyanine BG-Alexa647, which is already sulfonated, shows no specific labeling of GLP1RSNAP/SNAP islets (n = 14 islets, 4 animals). c, d BG-SulfoCy5 co-localizes with GLP1R mAb (c) and LUXendin551 (LUX551) (d) staining (GLP1R mAb, n = 22 islets, 10 animals; LUX551, n = 13 islets, 5 animals). e, f BG-Block has no effect on GLP1RWT/WT islets (e), but prevents BG-SulfoCy5 from labeling GLP1RSNAP/SNAP islets (f) (n = 7 islets, 3 animals). Scale bar = 85 µm for all images, except zoom in scale bar = 17 µm.
Fig. 5
Fig. 5. Multicellular GLP1R dynamics are ligand-dependent.
a Representative images of SBG-TMR labeled islets at 0, 10, 20 and 30 min post-stimulation with vehicle, exendin9, exendin4, semaglutide or tirzepatide (scale bar = 34 µm). b, c Proportion of cells showing internalization (b) and recruitment of cells into internalization (c) in response to vehicle, exendin9, exendin4, semaglutide or tirzepatide after 30 min (n = 4 islets, 3 animals). d, e Frequency distribution of internalization strength (d) and internalization rate (e) across the imaged cell population following vehicle- or ligand-stimulation (n = 4 islets, 3 animals). Bar graphs show mean ± SEM. Violin plots show median and interquartile range. Source data are provided as a Source Data file.
Fig. 6
Fig. 6. GLP1R dynamics are heterogeneous.
ae Cartesian (X-Y) maps for the islets in Fig. 5a showing cell position in the islet and changes in internalization strength over time following application of vehicle (a), or exendin9 (b), or stimulation with exendin4 (c), semaglutide (d) or tirzepatide (e) (representative plots from n = 4 islets, 3 animals). fj Cartesian (X-Y) maps showing cell subpopulations recruited into internalization at 10 min (subpopulation 1), 20 min (subpopulation 2) and 30 min (subpopulation 3) post-stimulation with vehicle (f), exendin9 (g), exendin4 (h), semaglutide (i) or tirzepatide (j), for the islets shown in Fig. 5a and the graphs displayed in Fig. 5b–e. ko Number of cells recruited into internalization at each time point following stimulation with vehicle (k), exendin9 (l), exendin4 (m), semaglutide (n) or tirzepatide (o) (one-way RM ANOVA with Dunnett’s or Bonferroni’s post-hoc test; vehicle: F = 2.97, DF = 3; exendin9: F = 6.39, DF = 3; exendin4: F = 16.60, DF = 3; semaglutide: F = 6.99, DF = 3; tirzepatide: F = 3.16, DF = 3) (n = 4 islets, 3 animals). p Schematic showing relative effects of the various agonists on trafficking within cell sub-populations 1, 2, and 3 (font size = strength of effect). **P < 0.05, **P < 0.01, NS, non-significant. Violin plots show median and interquartile range. Source data are provided as a Source Data file.
Fig. 7
Fig. 7. GLP1R form nanodomains in primary tissue and cells.
a BG-SulfoCy5 signal is detected in GLP1RSNAP/SNAP islets following formalin fixation and counter-staining for F-actin using Phalloidin-iFluor 488 (scale bar = 85 µm). b dSTORM signal is undetectable in GLP1RWT/WT islets labeled with BG-SulfoCy5 (n = 4 islets, 3 animals) (scale bar = 85 µm). c, dSTORM reveals organization of GLP1R into nanodomains at the beta cell membrane in intact pancreatic islets (n = 8 islets, 3 animals) (scale bar = 8 µm, and scale bar = 1.2 µm for zoom). d DBSCAN analysis shows GLP1R clusters in GLP1RSNAP/SNAP but not GLP1RWT/WT islets (scale bar = 500 nm) (n = 4–8 islets, 3 animals). e Representative images from live-cell single molecule microscopy showing labeling of GLP1R in primary dissociated beta cells in non-stimulated and Ex4-stimulated states (n = 3 animals) (note that different cells were used for non-stimulated and stimulated conditions) (scale bar = 10 µm). f Representative maps showing GLP1R trajectories in non-stimulated and Ex4-stimulated states (green = freely diffusing; pink = trapped) (zoom-ins shown in the bottom panel, demarcated by a box; scale bar = 5 µm). g Measurement of diffusion coefficient (D) and trapping analysis reveal a shift from freely-diffusing to trapped receptors following Ex4-stimulation (two-sided Mann-Whitney test) (n = 27 trajectories, 3 animals). ****P < 0.0001. Scatter plot shows mean and 95% confidence interval. Source data are provided as a Source Data file.

Similar articles

Cited by

References

    1. Kobilka BK. G protein coupled receptor structure and activation. Biochim. Biophys. Acta. 2007;1768:794–807. doi: 10.1016/j.bbamem.2006.10.021. - DOI - PMC - PubMed
    1. Sriram K, Insel PA. G Protein-coupled receptors as targets for approved drugs: How many targets and how many drugs? Mol. Pharm. 2018;93:251–258. doi: 10.1124/mol.117.111062. - DOI - PMC - PubMed
    1. Benninger RKP, Hodson DJ. New Understanding of β-Cell Heterogeneity and In Situ Islet Function. Diabetes. 2018;67:537–547. doi: 10.2337/dbi17-0040. - DOI - PMC - PubMed
    1. Nasteska D, Hodson DJ. The role of beta cell heterogeneity in islet function and insulin release. J. Mol. Endocrinol. 2018;61:R43–R60. doi: 10.1530/JME-18-0011. - DOI - PMC - PubMed
    1. Liu JS, Hebrok M. All mixed up: Defining roles for beta-cell subtypes in mature islets. Genes Dev. 2017;31:228–240. doi: 10.1101/gad.294389.116. - DOI - PMC - PubMed

Publication types

Substances