A meta-validated immune infiltration-related gene model predicts prognosis and immunotherapy sensitivity in HNSCC
- PMID: 36639648
- PMCID: PMC9837972
- DOI: 10.1186/s12885-023-10532-y
A meta-validated immune infiltration-related gene model predicts prognosis and immunotherapy sensitivity in HNSCC
Abstract
Background: Tumor microenvironment (TME) is of great importance to regulate the initiation and advance of cancer. The immune infiltration patterns of TME have been considered to impact the prognosis and immunotherapy sensitivity in Head and Neck squamous cell carcinoma (HNSCC). Whereas, specific molecular targets and cell components involved in the HNSCC tumor microenvironment remain a twilight zone.
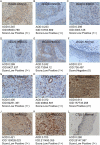
Methods: Immune scores of TCGA-HNSCC patients were calculated via ESTIMATE algorithm, followed by weighted gene co-expression network analysis (WGCNA) to filter immune infiltration-related gene modules. Univariate, the least absolute shrinkage and selection operator (LASSO), and multivariate cox regression were applied to construct the prognostic model. The predictive capacity was validated by meta-analysis including external dataset GSE65858, GSE41613 and GSE686. Model candidate genes were verified at mRNA and protein levels using public database and independent specimens of immunohistochemistry. Immunotherapy-treated cohort GSE159067, TIDE and CIBERSORT were used to evaluate the features of immunotherapy responsiveness and immune infiltration in HNSCC.
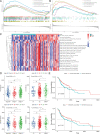
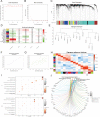
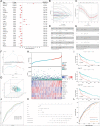
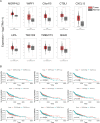
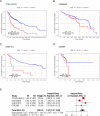
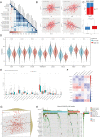
Results: Immune microenvironment was significantly associated with the prognosis of HNSCC patients. Total 277 immune infiltration-related genes were filtered by WGCNA and involved in various immune processes. Cox regression identified nine prognostic immune infiltration-related genes (MORF4L2, CTSL1, TBC1D2, C5orf15, LIPA, WIPF1, CXCL13, TMEM173, ISG20) to build a risk score. Most candidate genes were highly expressed in HNSCC tissues at mRNA and protein levels. Survival meta-analysis illustrated high prognostic accuracy of the model in the discovery cohort and validation cohort. Higher proportion of progression-free outcomes, lower TIDE scores and higher expression levels of immune checkpoint genes indicated enhanced immunotherapy responsiveness in low-risk patients. Decreased memory B cells, CD8+ T cells, follicular helper T cells, regulatory T cells, and increased activated dendritic cells and activated mast cells were identified as crucial immune cells in the TME of high-risk patients.
Conclusions: The immune infiltration-related gene model was well-qualified and provided novel biomarkers for the prognosis of HNSCC.
Keywords: Head and neck squamous cell carcinoma; Immune cell infiltration; Immunotherapy sensitivity; Prognostic model; Tumor microenvironment.
© 2023. The Author(s).
Conflict of interest statement
The authors declare no conflict of interest.
Figures


Similar articles
-
An angiogenesis-associated gene-based signature predicting prognosis and immunotherapy efficacy of head and neck squamous cell carcinoma patients.J Cancer Res Clin Oncol. 2024 Feb 12;150(2):91. doi: 10.1007/s00432-024-05606-8. J Cancer Res Clin Oncol. 2024. PMID: 38347320 Free PMC article.
-
FAM3D as a Prognostic Indicator of Head and Neck Squamous Cell Carcinoma Is Associated with Immune Infiltration.Comput Math Methods Med. 2022 Dec 3;2022:5851755. doi: 10.1155/2022/5851755. eCollection 2022. Comput Math Methods Med. 2022. PMID: 36510584 Free PMC article.
-
Multiomics data analyses to identify SLC25A17 as a novel biomarker to predict the prognosis and immune microenvironment in head and neck squamous cell carcinoma.BMC Bioinformatics. 2023 Jun 29;24(1):269. doi: 10.1186/s12859-023-05399-6. BMC Bioinformatics. 2023. PMID: 37386359 Free PMC article.
-
Development and experimental verification of a prognosis model for disulfidptosis-associated genes in HNSCC.Medicine (Baltimore). 2024 Mar 22;103(12):e37308. doi: 10.1097/MD.0000000000037308. Medicine (Baltimore). 2024. PMID: 38518012 Free PMC article. Review.
-
Comprehensive review regarding the association of E2Fs with the prognosis and immune infiltrates in human head and neck squamous cell carcinoma.Asian J Surg. 2024 May;47(5):2106-2121. doi: 10.1016/j.asjsur.2024.01.130. Epub 2024 Feb 5. Asian J Surg. 2024. PMID: 38320907 Review.
Cited by
-
Bufalin Suppresses Head and Neck Cancer Development by Modulating Immune Responses and Targeting the β-Catenin Signaling Pathway.Cancers (Basel). 2024 Aug 1;16(15):2739. doi: 10.3390/cancers16152739. Cancers (Basel). 2024. PMID: 39123466 Free PMC article.
-
Type I conventional dendritic cells and CD8+ T cells predict favorable clinical outcome of head and neck squamous cell carcinoma patients.Front Immunol. 2024 Jun 13;15:1414298. doi: 10.3389/fimmu.2024.1414298. eCollection 2024. Front Immunol. 2024. PMID: 38938577 Free PMC article.
-
Macrophage Profiling in Head and Neck Cancer to Improve Patient Prognosis and Assessment of Cancer Cell-Macrophage Interactions Using Three-Dimensional Coculture Models.Int J Mol Sci. 2023 Aug 15;24(16):12813. doi: 10.3390/ijms241612813. Int J Mol Sci. 2023. PMID: 37628994 Free PMC article.
-
Development of prognostic model incorporating a ferroptosis/cuproptosis-related signature and mutational landscape analysis in muscle-invasive bladder cancer.BMC Cancer. 2024 Aug 6;24(1):958. doi: 10.1186/s12885-024-12741-5. BMC Cancer. 2024. PMID: 39107713 Free PMC article.
-
The Complex Role of Mast Cells in Head and Neck Squamous Cell Carcinoma: A Systematic Review.Medicina (Kaunas). 2024 Jul 19;60(7):1173. doi: 10.3390/medicina60071173. Medicina (Kaunas). 2024. PMID: 39064602 Free PMC article. Review.
References
-
- Sung H, Ferlay J, Siegel RL, Laversanne M, Soerjomataram I, Jemal A, et al. Global Cancer statistics 2020: GLOBOCAN estimates of incidence and mortality worldwide for 36 cancers in 185 countries. CA Cancer J Clin. 2021;71(3):209–249. - PubMed
-
- Chow LQM. Head and neck Cancer. N Engl J Med. 2020;382(1):60–72. - PubMed
Publication types
MeSH terms
Substances
Grants and funding
LinkOut - more resources
Full Text Sources
Medical
Research Materials

