. 2023 Feb 14;23(4):624-630.
doi: 10.1039/d2lc01024k.

Portable light-sheet optofluidic microscopy for 3D fluorescence imaging flow cytometry

Affiliations

Portable light-sheet optofluidic microscopy for 3D fluorescence imaging flow cytometry

Jeonghwan Son et al. Lab Chip. .

Abstract

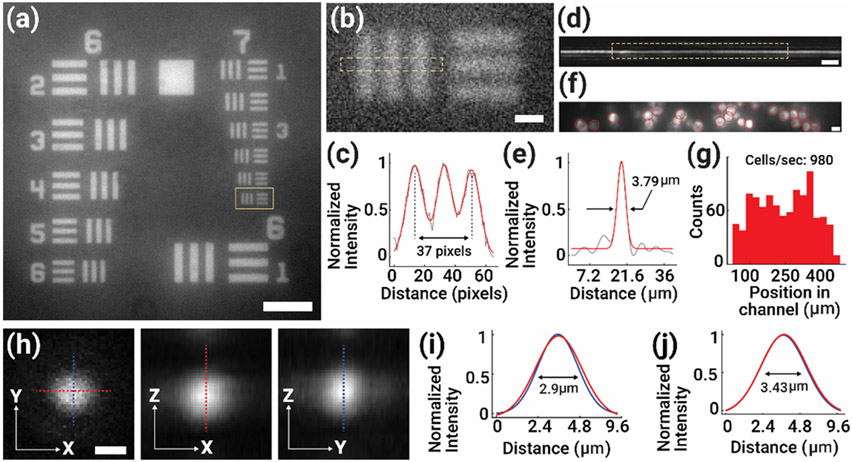
Imaging flow cytometry (IFC) combines conventional flow cytometry with optical microscopy, allowing for high-throughput, multi-parameter screening of single-cell specimens with morphological and spatial information. However, current 3D IFC systems are limited by instrumental complexity and incompatibility with available microfluidic devices or operations. Here, we report portable light-sheet optofluidic microscopy (PLSOM) for 3D fluorescence cytometric imaging. PLSOM exploits a compact, open-top light-sheet configuration compatible with commonly adopted microfluidic chips. The system offers a subcellular resolution (2-4 μm) in all three dimensions, high throughput (∼1000 cells per s), and portability (30 cm (l) × 10 cm (w) × 26 cm (h)). We demonstrated PLSOM for 3D IFC using various phantom and cell systems. The low-cost and custom-built architecture of PLSOM permits easy adaptability and dissemination for broad 3D flow cytometric investigations.


Conflict of interest statement

Conflicts of interest

G.A.K. is co-founder and equity shareholder of Glympse Bio and Port Therapeutics. This study could affect his personal financial status. The terms of this arrangement have been reviewed and approved by Georgia Tech in accordance with its conflict-of-interest policies.

Figures

Figure 1.
Figure 1.. Portable light-sheet optofluidic microscopy (PLSOM) for 3D Imaging Flow Cytometry.
(a) Schematic of the PLSOM setup. The open-top configuration places the system underneath the microfluidic chip. The cylinder lens (CL) forms the thin light-sheet illumination at an angle of 36° with respect to the horizontal sample plane, and the objective lens (OL) collects the emitted light at the focal plane perpendicular to the axis of illumination. Both CL and OL are immersed in water to reduce the mismatch of refractive indices. (b) Photograph of the system. The details are illustrated in the Supplementary Information. LD, laser diode; L, lens; M, mirror; Ex, excitation; Em, emission. (c) Customized water-immersion chamber for the CL, OL, and sample holder. Insets (i, ii) show the CL and OL compounds (see Supplementary Information). (d) Data acquisition, kymography processing, and 3D reconstruction of PLSOM. Scale bar: 25 mm (b).
Figure 2.
Figure 2.. System characterization.
(a) Selected region of the bright-field image of a USAF target taken by PLSOM. (b) Zoomed-in image of the boxed region in (a). (c) Cross-sectional intensity profile of the boxed region in (b). The three bars span 37 pixels, corresponding to 14.5× magnification and 240-nm effective pixel size, based on the known physical size of the caliber sample (4.4 μm between adjacent bars). (d) Image of the mirror-reflected light sheet at the focal plane of illumination. (e) Cross-sectional intensity profile of the boxed region in (d), displaying the FWHM value of 3.79 μm. (f) Raw light-sheet image of HeLa cells stained and segmented for the plasma membrane in the microfluidic channel. (g) Histogram of cell counts across the FOV yields the experimental throughput of the system at ~1,000 cells/sec at the average flow speed of 207.9 μm/sec. (h) Reconstructed PSF images of a 200-nm fluorescent bead in x-y, x-z, and y-z dimensions. (i,j) Cross-sectional profiles across the dashed lines in (h) of the PSF in x-y (i) and z (j), exhibiting the FWHM values of 2.9 μm and 3.43 μm, respectively. Scale bars: 50 μm (a), 5 μm (b), 30 μm (d), 15 μm (f), 3 μm (h).
Figure 3.
Figure 3.. PLSOM imaging of microspheres and HeLa cells.
(a) Raw light-sheet image of mixed fluorescent microspheres (7 μm, orange arrow; 15 μm, green arrow) flowing through the microfluidic channel. (b-d) 3D reconstructed images of a 7-μm throughout-labelled bead at an average flow speed of 181.5 μm/sec in x-y (b, focal stack image), y-z (c, maximum intensity projection, or MIP), and x-z (d, MIP). The insets show the corresponding cross-sectional intensity profiles along the orange dashed lines. (e-g) 3D reconstructed images of a 15-μm surface-labelled bead at an average flow speed of 133.8 μm/sec in x-y (e, focal stack image), y-z (f, MIP), and x-z (g, MIP). The insets show the corresponding cross-sectional intensity profiles along the green dashed lines. (h) Histogram counts of the 3D reconstructed volumes, differentiating two distinct populations of microspheres with maxima at 224.4 ± 49.6 μm3 and 1650.4 ± 330.6 μm3. The dashed lines indicate the volume values (179.6 μm3 and 1767.1 μm3) derived based on the respective physical sizes of 7 μm and 15 μm. (i) Scatter plot of the total volumetric fluorescent intensity of the microsphere mixture as a function of the diameter as rendered from the experimental volume measurement in (h). (j-l) 3D reconstructed images of a membrane-labelled HeLa cell at an average flow speed of 111.4 μm/sec shown in x-y (j), y-z (k), x-z (l) stacks (step size = 2.4 μm). (m) 3D reconstructed volume of the cell in (j-l), where the hollow cellular structure was clearly observed. (n,o) Radial profiles (gray) of the cross-sectional intensity, as indicated by the arrows in (j-l), of the cell population in the lateral (n) and axial (o) dimensions, exhibiting the mean radii of 5.36 μm and 4.65 μm, respectively. (p) Histogram of cell volumes, showing the mean volume at 955.5 ± 322.8 μm3 of HeLa cells. Scale bars: 15 μm (a), 5 μm (b, e, j).
Figure 4.
Figure 4.. PLSOM imaging of human T (hT) cells and Jurkat (JK) cells.
(a) Four examples of 3D reconstructed mixed populations of cells in the flow. (b, c) 3D reconstructed membrane-labelled hT cells (b) and JK cells (c) in x-y, y-z, and x-z cross-sectional views. (d-g) Cross-sectional intensity profiles in x (d,f) and z (e,g) dimensions of hT cells (d,e) at an average flow speed of 54.5 μm/sec and JK cells (f,g) at an average flow speed of 147.2 μm/sec. (h) Scatter plot of the fluorescence intensity as a function of the cell volume. (i) Histogram counts of the cell diameters for the pure hT cell population (red, 6.9 μm) and the mixed populations (green, 7.4 μm and 11.7 μm) measured from the reconstructed focal stacks. Yellow bars denote the overlap of the two (red and green) distributions. The dashed lines indicate the size measurement of the two cell groups using the raw 2D datasets (8.1 μm and 12.3 μm). (j) Histogram counts of the corresponding cell volumes, showing more accurate 3D measurements compared to the 2D results of the raw datasets (dashed lines). Scale bars: 5 μm (b, c).
Figure 5.
Figure 5.. PLSOM imaging of drug-administered HeLa cells.
(a) Raw light-sheet image of the mixture of untreated (control) and Taxol-treated (experimental) HeLa cells. The orange arrow points to a cell with only the plasma membrane stained. The green arrow points to a cell with both the membrane and nucleus stained. (b, c) Cross-sectional images of the control and drug-affected cells in x-y, y-z, and x-z. (d-g) Corresponding cross-sectional intensity profiles of the control (d,e) at an average flow speed of 47 μm/sec and drug-affected (f,g) cells at an average flow speed of 65.8 μm/sec in the lateral (d,f) and axial (e,g) dimensions. (h) histogram counts of the fluorescence intensity ratio between the nucleus (NV) and the plasma membrane (PV). (i) The ratio as in (h) as a function of the cell volume, showing two main distributions of the control (low ratios and volumes) and drug-affected (linearly increased ratio and volumes) cells. (j) Principal components analysis (PCA) of the datasets, displaying two distinctive patterns of the unaffected cells and the ~40% drug-affected cells among the experimental group. The elliptical shadows denote 95% of the standard deviations in each group. Scale bars: 20 μm (a), 5 μm (b, c).

Similar articles

Cited by

References

    1. Huang NT, Zhang HL, Chung MT, Seo JH and Kurabayashi K, Lab Chip, 2014, 14, 1230–1245. - PubMed
    1. Fan X and White IM, Nature Photonics, 2011, 5, 591–597. - PMC - PubMed
    1. Psaltis D, Quake SR and Yang C, Nature, 2006, 442, 381–386. - PubMed
    1. Minzioni P, Osellame R, Sada C, Zhao S, Omenetto FG, Gylfason KB, Haraldsson T, Zhang YB, Ozcan A, Wax A, Mugele F, Schmidt H, Testa G, Bernini R, Guck J, Liberale C, Berg-Sorensen K, Chen J, Pollnau M, Xiong S, Liu AQ, Shiue CC, Fan SK, Erickson D and Sinton D, Journal of Optics, 2017, 19, 093003.
    1. Han Y, Gu Y, Zhang AC and Lo YH, Lab Chip, 2016, 16, 4639–4647. - PMC - PubMed

Publication types